Survey Dashboard Examples
Surveys are a great way of gathering information from your stakeholders. Whether you’re looking to improve your customers’ perception of your organisation, or engage your staff to work harder for you and more. Whatever it is you’re trying to achieve, the data that surveys provide can help get you there.
However, whatever you’re trying to do, there’s nearly always time pressure involved, and you’re required to act quickly, otherwise opportunities can be lost, or situations made worse rather than improved. Yet, unless you have the means to view all your key survey findings in one place and swiftly be able to get to and understand what’s most important from what’s being presented to you, it will be hard to meet these deadlines.
Fortunately, if you have access to a survey dashboard tool, you’ll have all the data you need at your fingertips to quickly make informed decisions and take swift action.
However, the best way to appreciate this is to see a few examples. But before we take you through that, it’s helpful to go into a bit more detail about what a survey dashboard is and why it’s important.
Why is the survey dashboard important?
The key thing about the survey dashboard is that it can take lots of raw data that would otherwise be really difficult to grasp and convert it into more easily understandable visuals.
Humans process visuals much faster than text, which makes the survey dashboard a game changer when it comes to quickly seeing what’s most important and being able to make more informed decisions as a result.
Here’s a brief overview of why visualising data in this way helps you.
- Simpler to understand: Pictures make data much easier, by helping us understand what the numbers are saying without getting lost in them
- Identify patterns and trends: Images help reveal trends and patterns in the data, by magnifying what’s most important, which might otherwise become hidden in the numbers
- Faster and better decisions: When we can see the whole picture, it’s simpler and quicker to make the right choices
- Improves data recall: Visual rather than text data stays in our minds better, making it easier to recall key insights we’ve seen when we need to talk about them in the future
We hope through this you can recognise the value of being able to visualise all your key survey data in one dashboard. However, to get a better sense of the benefits of being able to track, measure and analyse your survey data in one place, it’s useful to be able to explore a few survey dashboard examples, which we will look at next.
Survey dashboard examples
When it comes to the look of your survey dashboard, a lot will depend on your job title or department that you’re working within, the types of surveys you’re running and what you’re looking to measure.
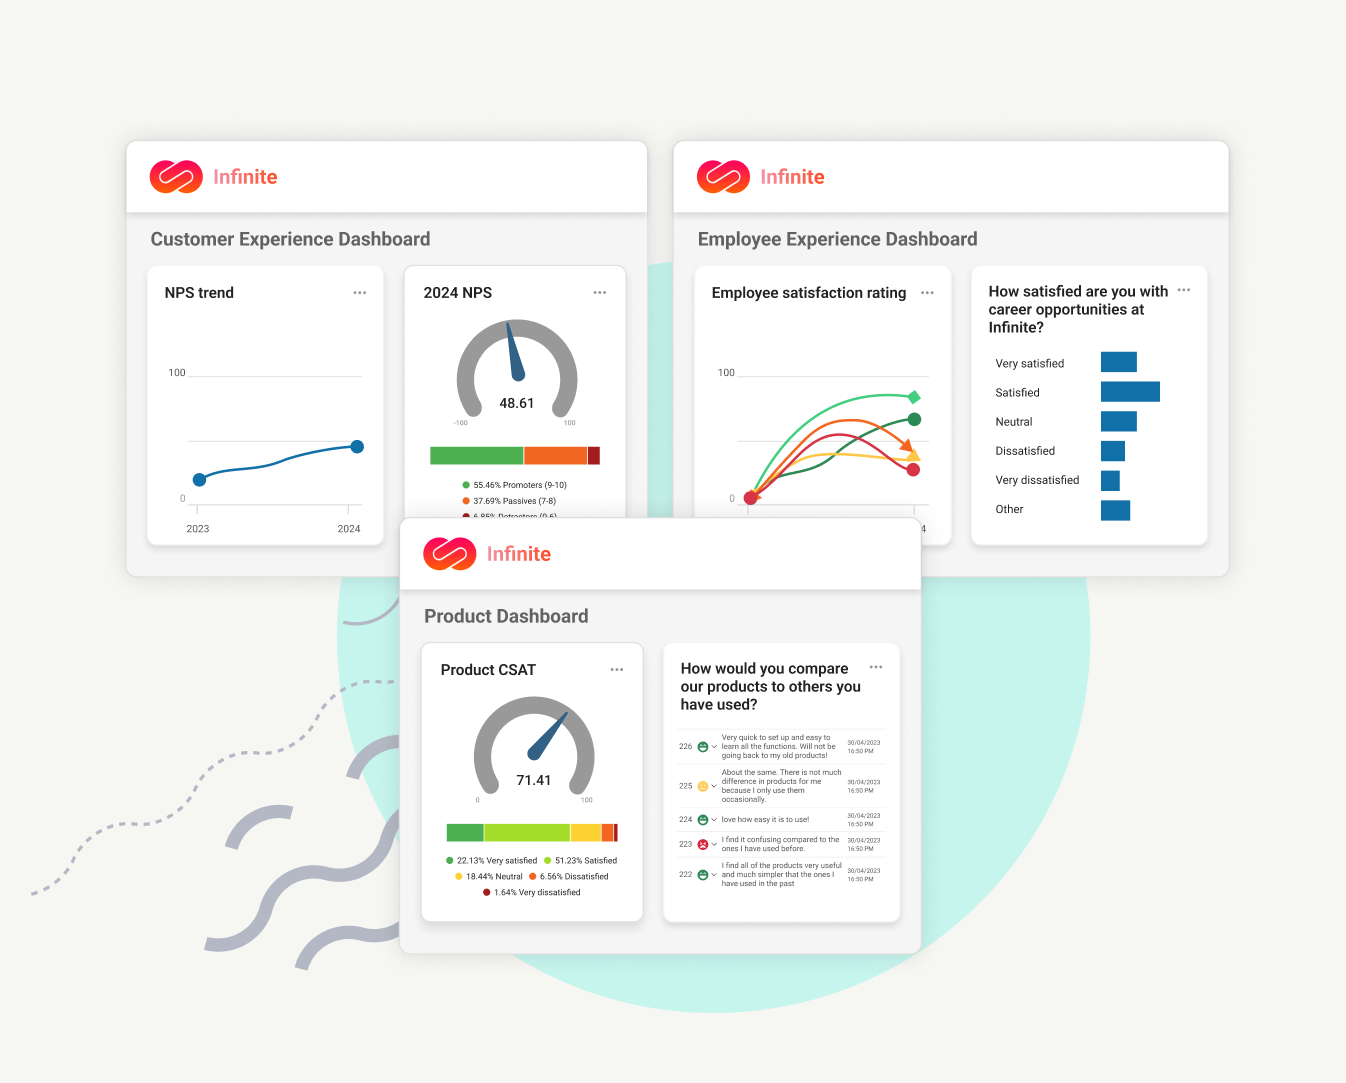
For the intents and purpose of this piece we will look at some fictitious survey dashboard examples that cover more generic areas including employee engagement, customer satisfaction and product performance.
Employee engagement
Consider you’re working for an HR team, or you're a business owner without an HR department who is handling staffing issues by yourself. Either way, you’ll want to ensure your staff are happy and working to the best of their abilities.
Yet, this will depend on a lot of things including the workplace conditions, processes, policies and culture you’ve put in place and nurtured for those employees. So, you’ll want to ensure that they’re right.
However, you won’t really know how effective they are unless you ask your employees directly, which requires regularly surveying them and being able to track, monitor and analyse their feedback in a survey dashboard.
Surveys and key metrics
While there’s a wide range of employee surveys you could potentially employ to get staff feedback, one of the most commonly used surveys among employers is the employee engagement survey.
Typically run quarterly or half yearly, feedback from key questions in this survey on topics ranging from culture and working conditions to benefits, training and development, and much more can be displayed on the employee dashboard. In addition, with the inclusion of key metrics such as employee net promoter score (eNPS), you can ensure you’re always aware of the levels of happiness within your workforce and your employees’ willingness to recommend you to others outside of your organisation.
With the availability of various charts including metric gauge and trend charts, along with filters and date ranges, it’s also possible to analyse data in real-time or historically, so you’re always on track of any developing issues both good and bad.
Customer satisfaction
This time imagine you’re a team leader or customer support manager trying to maintain healthy levels of customer satisfaction. This will of course depend on the level of service your support teams and wider organisation deliver for these customers.
From the length of time it takes to answer and manage customer queries to the helpfulness of your staff and how well they resolve customer issues. While there’s a lot of things that can affect customer satisfaction, you won’t know what impacts your customers the most unless you’re regularly reaching out to them for feedback, and tracking, monitoring and analysing that comment in a survey dashboard.
Surveys and key metrics
From customer service to customer effort score surveys and more. While there is a wide range of customer surveys you could potentially use to assess customer sentiment, one of the most effective particularly for customer support managers is the customer satisfaction survey.
While a customer satisfaction survey can provide you with a lot of insight into the contentment levels of your customers, one of the best questions to highlight on your dashboard is customer feedback to the customer satisfaction score (CSAT) metric. Essentially, this metric question can be used to measure customer satisfaction after every interaction a customer has with your support teams. You can then keep track of your ongoing CSAT score and the general sentiment it reflects, through the use of the dashboard’s CSAT metric gauge and trend charts.
In addition, with any customer satisfaction survey, it’s useful to be able to delve deeper into your customer’s thoughts and feelings, as this can often reveal interesting insights that you need to be acting on, particularly when many customers are saying the same things. This is where asking your customers open-ended questions, where they can provide more detailed written feedback can be hugely beneficial. But to get the full benefit from this you need a quick and effective way of monitoring and analysing this.
Fortunately, if your dashboard tools are available with sentiment analysis, it will give you an effective way of monitoring and analysing these comments. By automatically tagging open text question responses, sentiment analysis allows you to quickly identify good, bad or neutral comments. So, let’s say, you asked your customers to describe their experience of your support team, sentiment analysis tools could help you to more easily spot any developing issues you should be addressing before they become more harmful to your business.
Product survey
Besides your employees or more general customer audience groups, you may be working in a more niche area where you need to track, monitor and analyse feedback.
Let’s say you’re a product manager. In this scenario, your biggest objectives will be to ensure the ongoing success of existing products and the successful development and growth of new product lines. However, this will depend on how happy your customers are with your products and any new developments you introduce.
From what they most like and don’t like about your product, to how often they use it, how likely they would be to recommend it to others and more. Getting and analysing ongoing product feedback from your customers is essential if you’re to carry on delivering great products or make the improvements your customers are demanding to see.
Surveys and key metrics
From a product awareness or product satisfaction survey to a product feedback form on your website or app and more. There’s a wide range of product surveys you could potentially use to get feedback about your products.
However, besides more general feedback from these surveys, you’ll want to be able to quickly measure and gain some top-level insight into how happy your customers are with your products. One of the most effective ways of doing this is by asking your customers the product net promoter score (product NPS) metric question. Similar to other NPS questions, the product NPS looks to measure your customers likelihood to recommend you to others, in this case for your products.
To experience the greatest benefits using this metric question, you’ll want access to dashboard tools, that allow you to display your ongoing score through metric gauge and trend charts, that way you can track your product performance in real-time and historically.
Similarly, to customer satisfaction surveys, if the dashboard tools you use with your product surveys also include sentiment analysis tools, you’ll have an effective way of monitoring and analysing customer feedback to any open-ended questions you’ve included. This is important, because if you were to ask your customers about how they felt your product could be improved, you could quickly home in on what’s most important to them and make the improvements they want to see.
Keeping on top of positive and negative feedback
If you’re not already familiar with survey dashboard technology, we hope these examples will give you a better idea about how you can use the ongoing feedback from surveys with dashboards to improve whatever business objectives you have.
With all your key insights available in a single-page view, one of the most important things a dashboard offers is the ability to keep on top of fast-changing sentiments both positive and negative. And the great thing about this is not only can you prevent any negative trends from becoming potentially more harmful, but you can also take advantage of the opportunities provided by more positive customer feedback. This makes the implementation of a survey dashboard a win-win, however you decide to use it.
The right dashboard’s the key to the best decisions and actions
While any dashboard tool can help improve your survey data analysis, only the best survey dashboards can improve your decision making and the actions you take as a result.
Find out more


