
Find customer friction and fix it before they churn


Turn effort insights into better experiences
Start finding friction points today
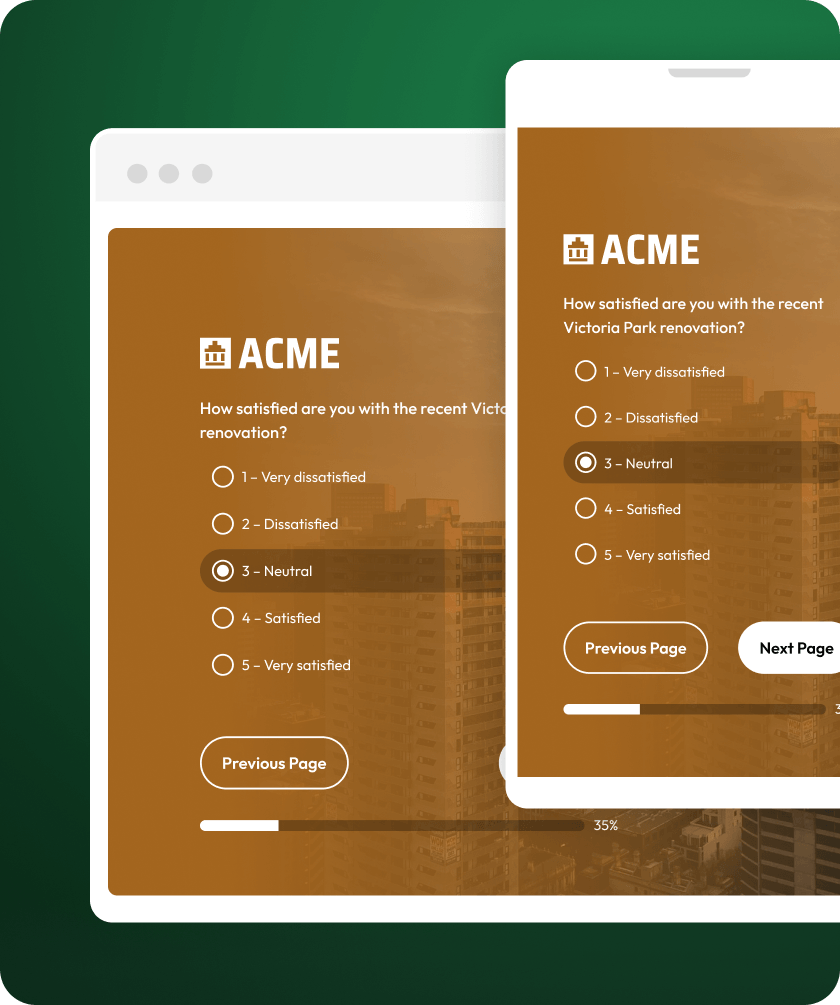
Build and launch branded CES surveys in minutes. No technical setup, no delays.
Catch high-effort experiences immediately
Trigger CES surveys right after support calls, checkouts, onboarding, or self-service.
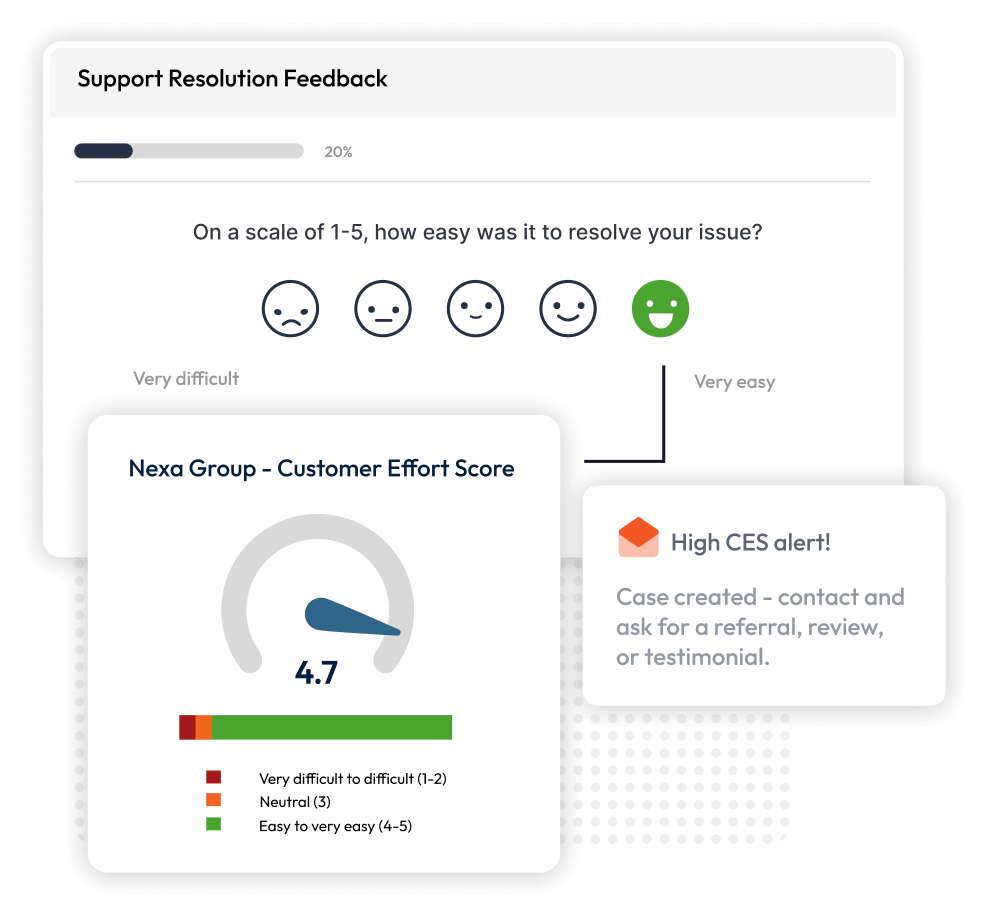
Spot friction before It leads to lost revenue
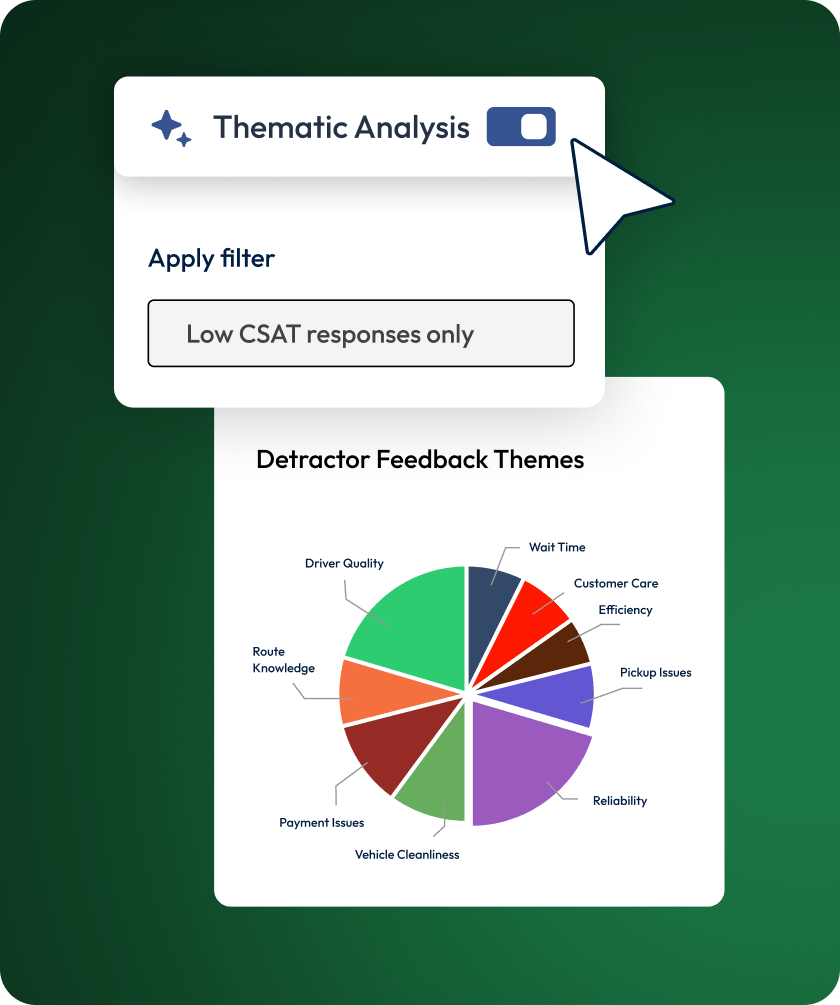
See exactly where effort is too high and which friction points are putting retention at risk.
Prove friction is going down
Track effort scores over time. See whether fixes reduced friction and show leadership measurable progress.
Capture effort feedback when it matters most
Know which touchpoints are costing customers
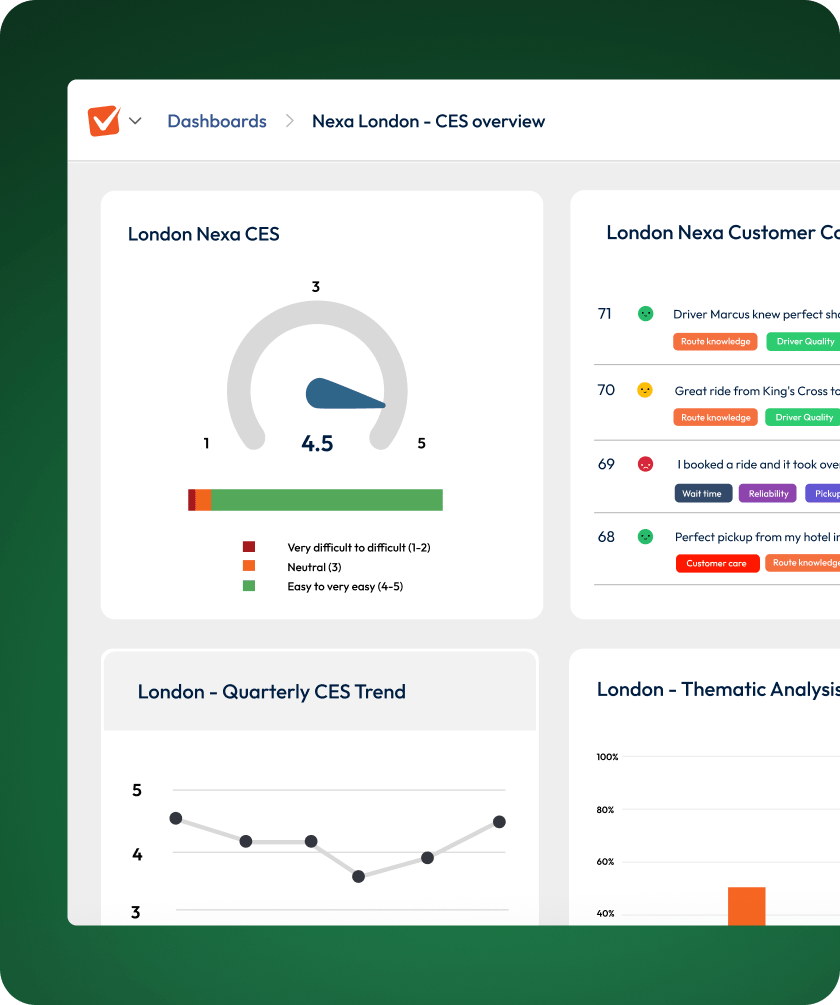
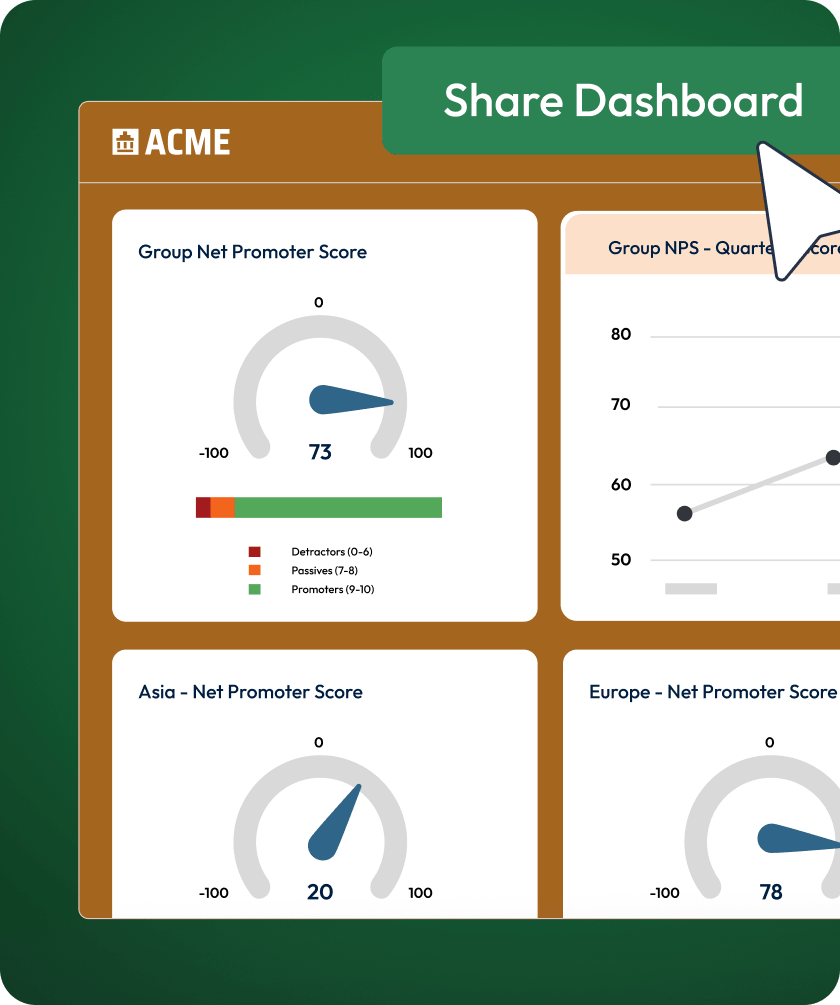
Report on effort and prove your programme’s impact
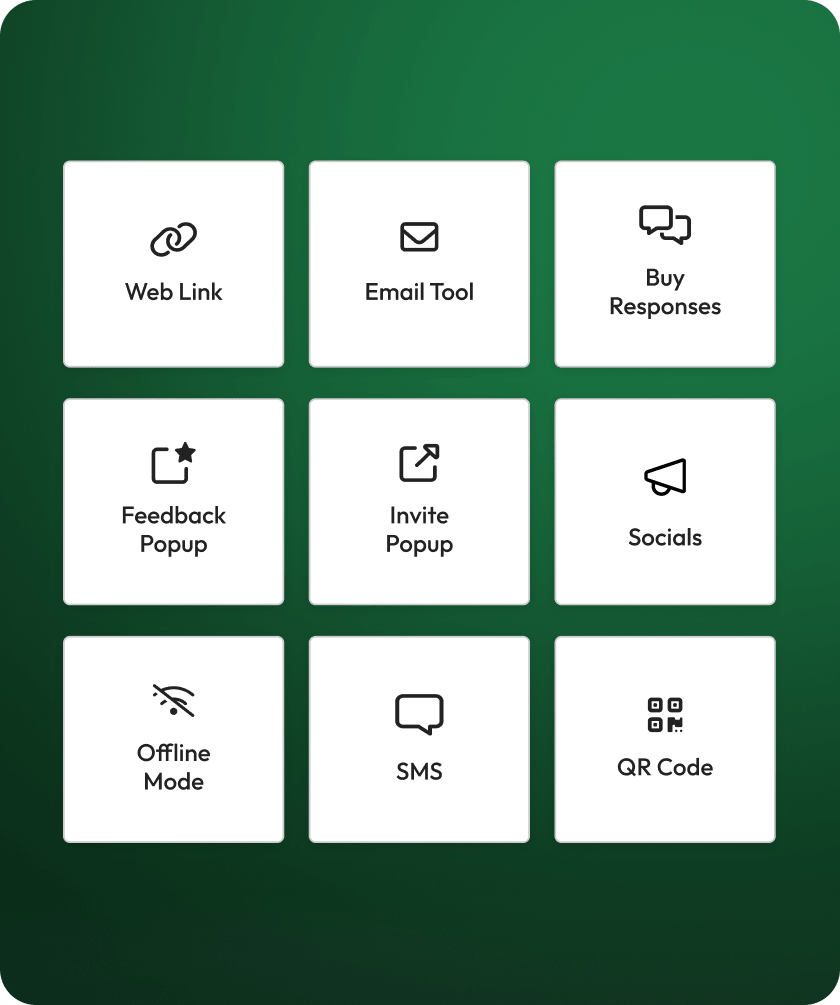
Get more from your CES programme
Other tools
Just a score - no logic or text analysis, so you never learn why things feel hard
Weeks of manual comment sifting to uncover root‑cause effort drivers
Teams guess what to fix, often tackling the wrong problem and wasting cycles
Feedback piles up with no clear follow‑up path - customers keep struggling
Siloed data means effort signals stay hidden until churn shows up in reports
CES with SmartSurvey
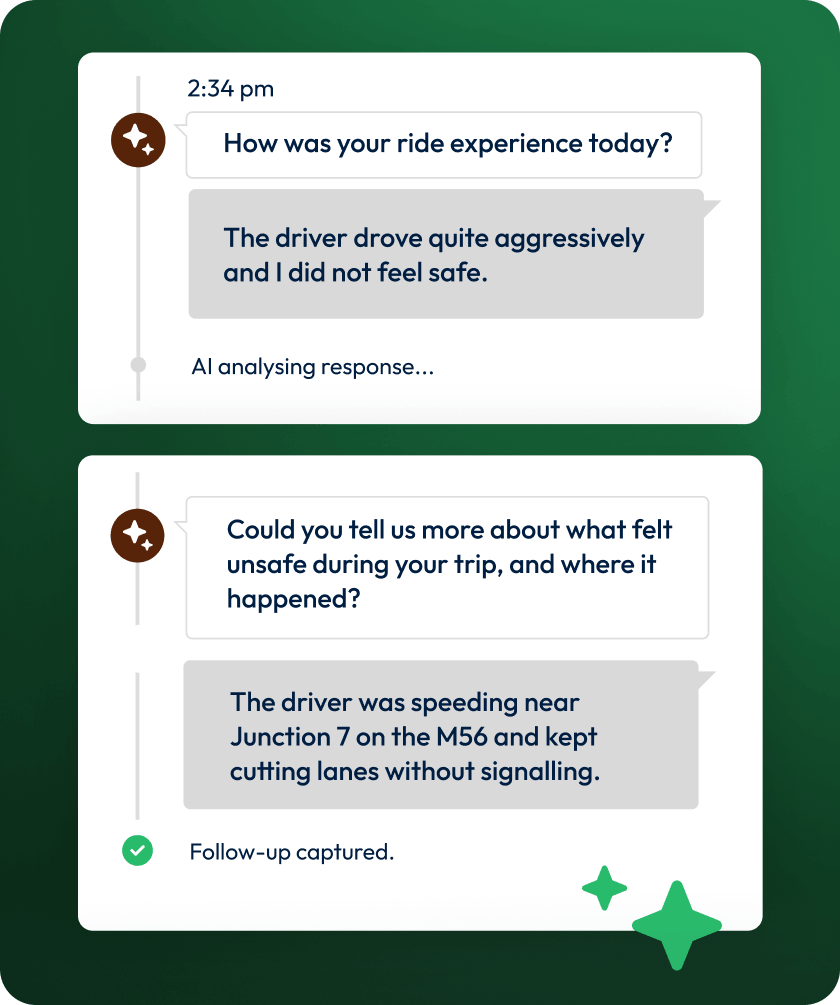
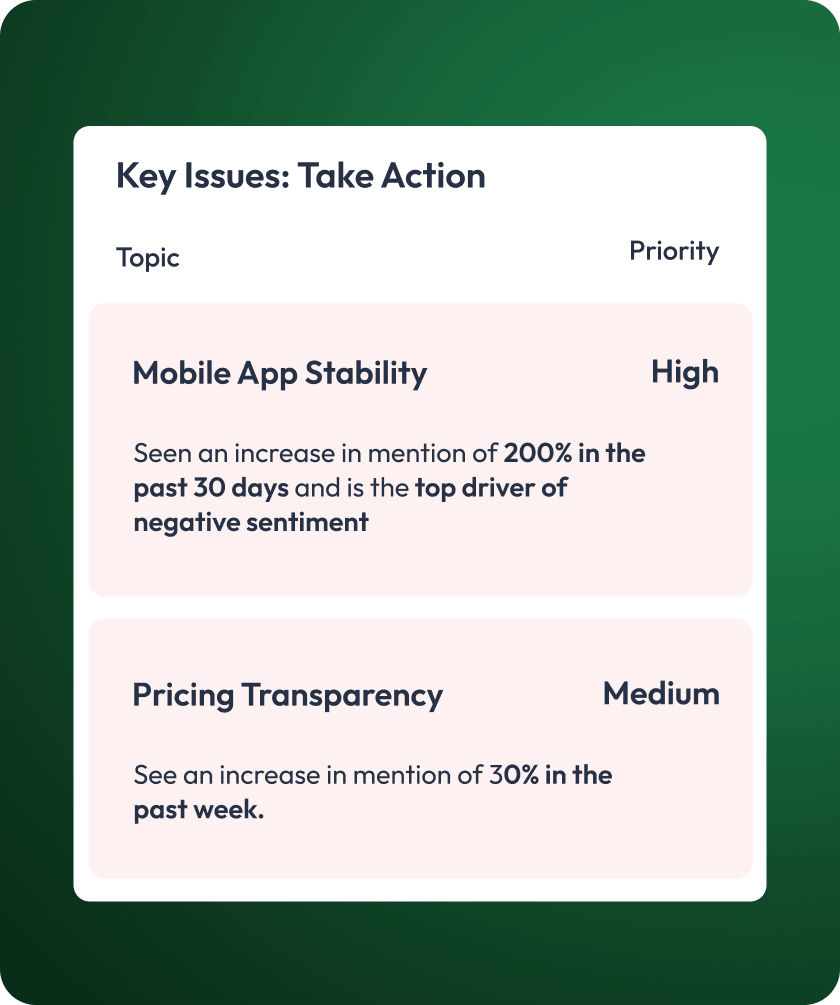
Skip logic and AI text insights pinpoint the exact step causing friction
AI surfaces recurring pain points in seconds – no spreadsheets needed
Live CES dashboards flag high‑effort journeys so the right team acts fast
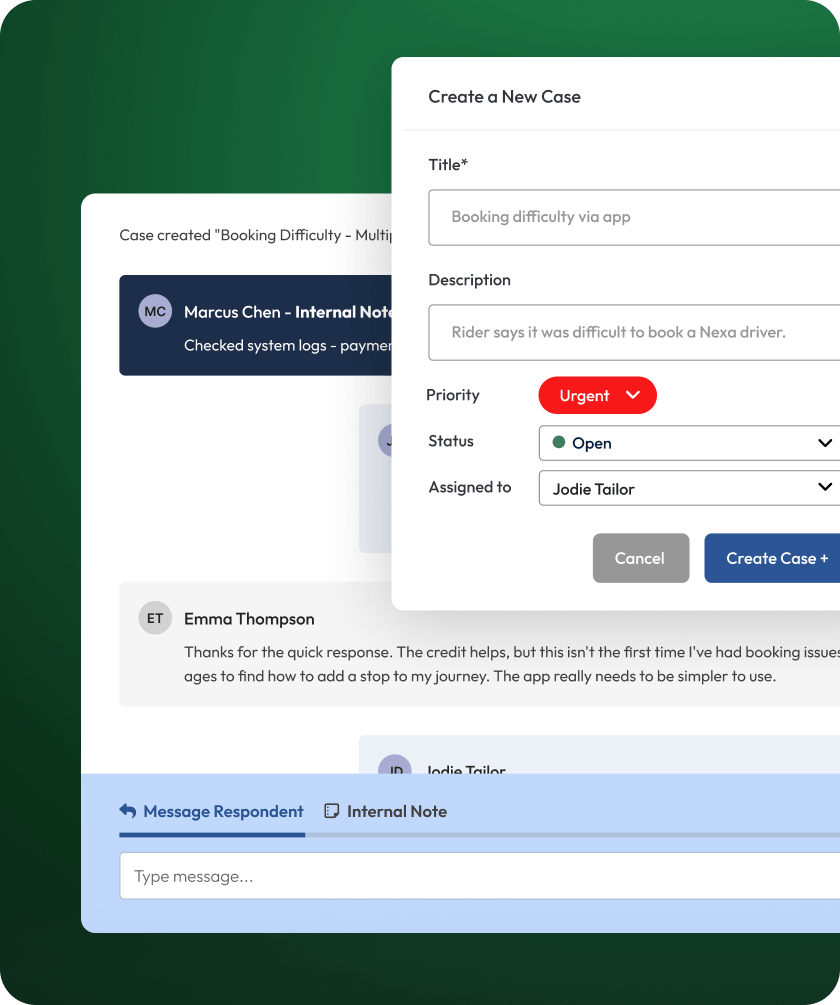
Built-in case management helps you close the loop fast on every single response
One platform unites surveys, dashboards, and follow-ups so effort never stays hidden
See how teams like yours improved CX
“SmartSurvey combines user-friendliness with the security we need. It’s helped us make data-driven decisions to deliver better experiences.”
“Since we have been using SmartSurvey,
I would not look elsewhere for any other provider.”


What is Customer Effort Score (CES)?

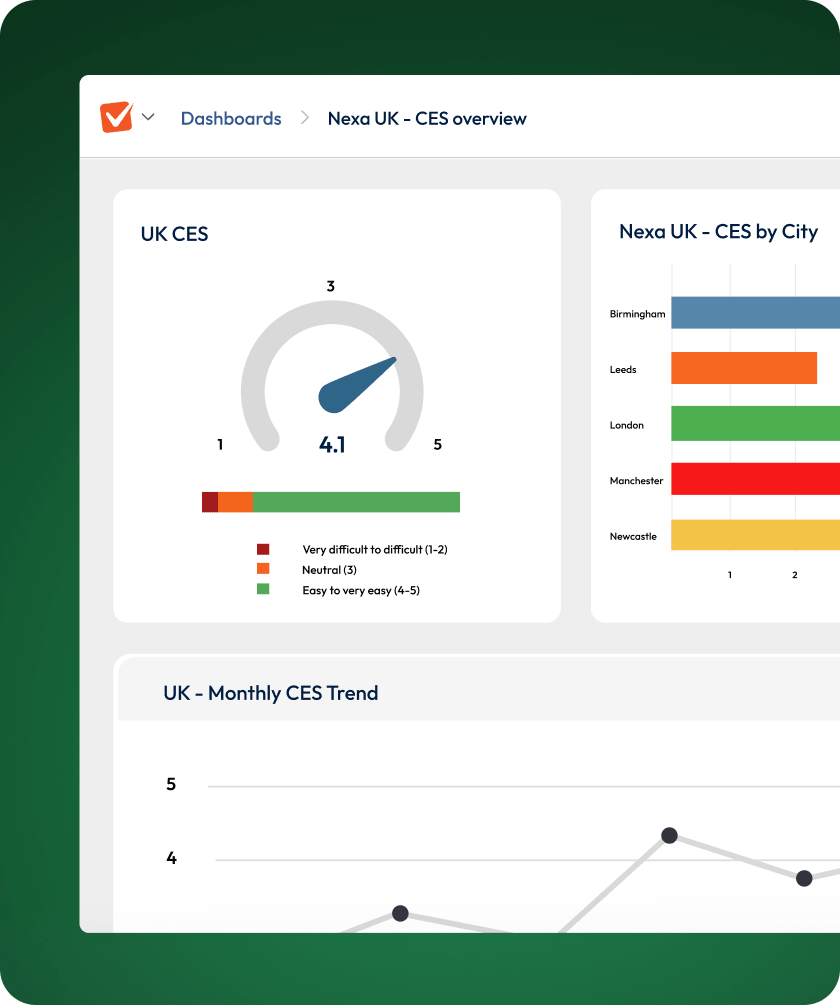
If your responses are 5, 4, 4, 3, and 2, your CES score is 3.6 out of 5. This average helps you track effort levels over time.
See what lower effort can help you achieve
Frequently asked questions
Built to fit seamlessly into your existing workflows. Embed surveys directly into websites and apps, connect with Salesforce or HubSpot to pull in contact data, or push results to Power BI for advanced reporting. We also offer API and webhook access for custom integrations.
Yes. SmartSurvey is ISO27001 certified and Cyber Essentials Plus accredited. All data is encrypted both in transit using TLS and at rest using AES encryption. We're fully GDPR compliant and offer localised data storage options upon request.
Of course. After we understand your needs, we'll show you a personalised demo and set you up on a trial so you can get hands-on with the product. Start by requesting a demo.
Pricing depends on your requirements, so we'd love to have a conversation about the ideal solution for you. We want to make sure we're both a good fit and scope a solution that provides maximum value. Book a demo to get started.

