Real-time survey analysis

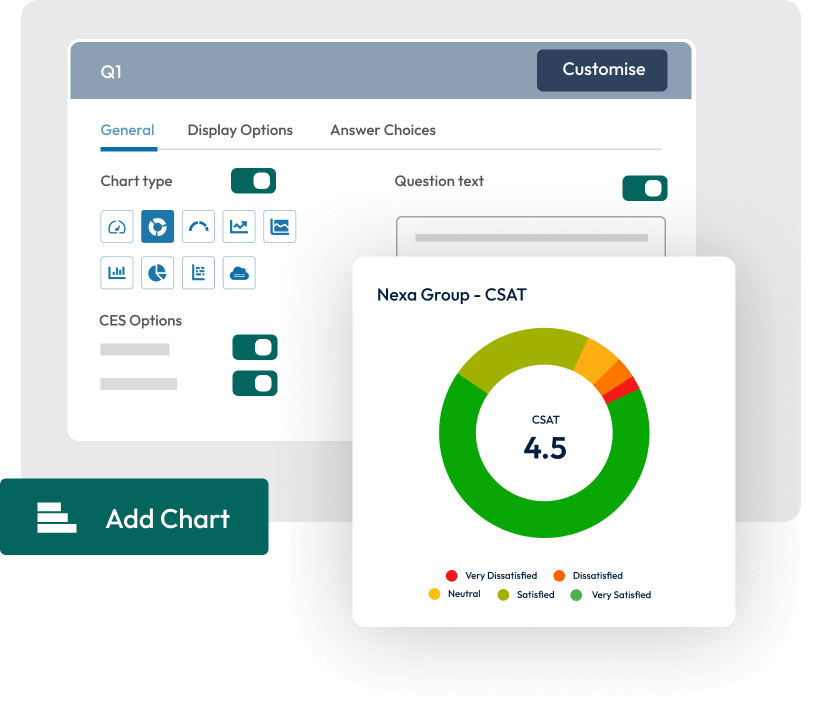
Visualise data with Charts
SmartSurvey Charts are clear, effective, beautiful, and customisable. Select from a selection of chart types for every question, customise colours, labels, and scales, however you feel is the best way to make sense of and communicate your survey data.
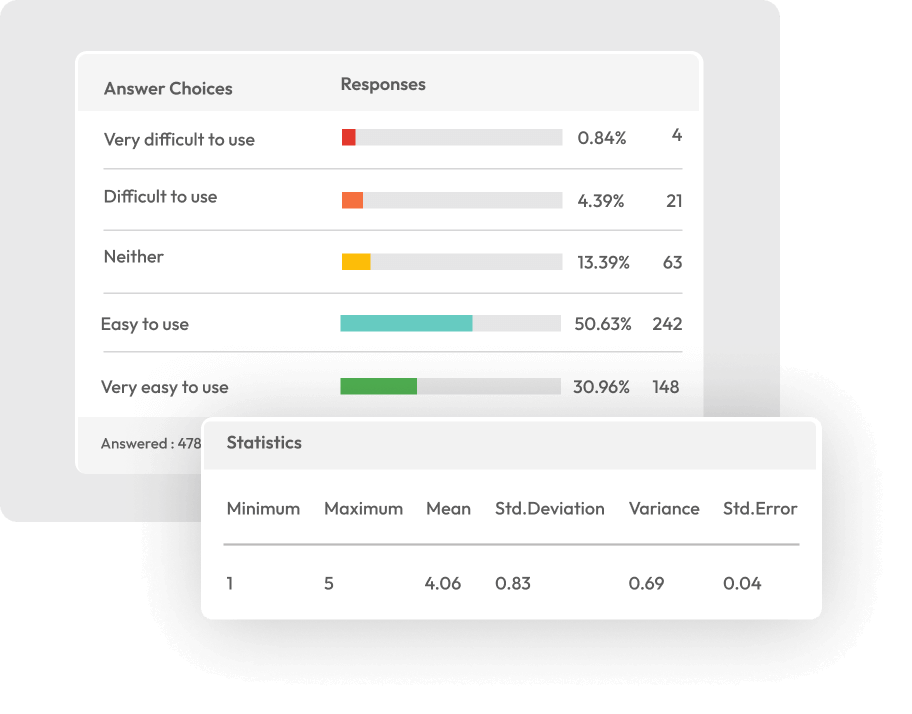
Auto-calculate basic statistical data
Automatically calculate standard statistical information relating to your survey data. For every quantitative question, you can instantly know the Minimum, Maximum, Mean, Standard Deviation, variance, and standard error, saving you time and the need to export and calculate these values in a spreadsheet.
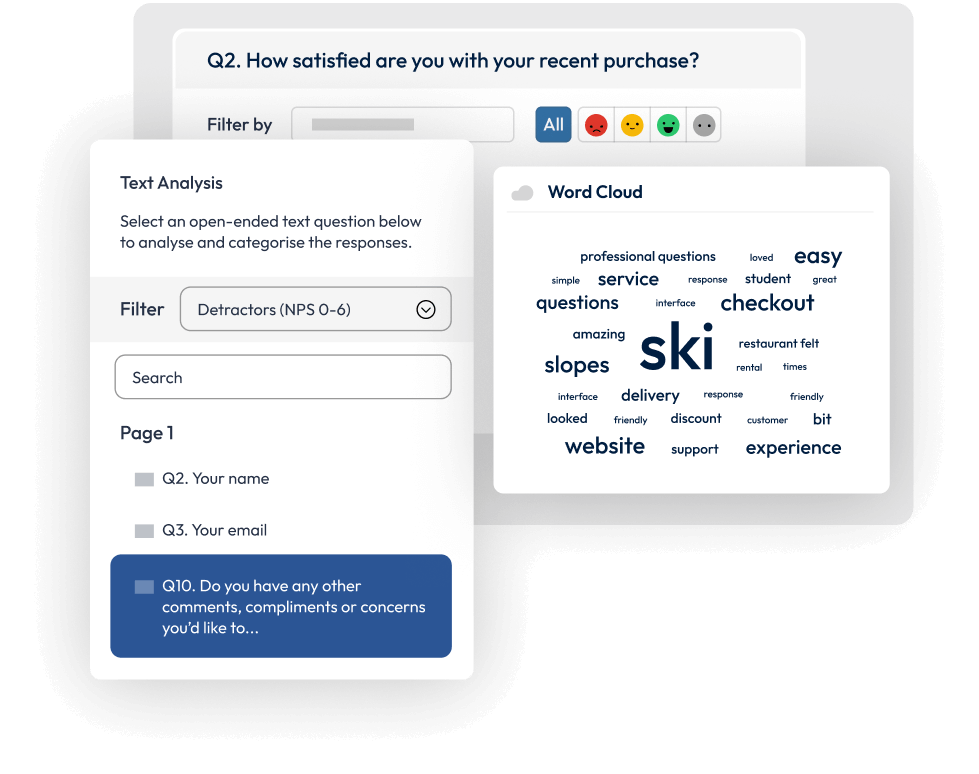
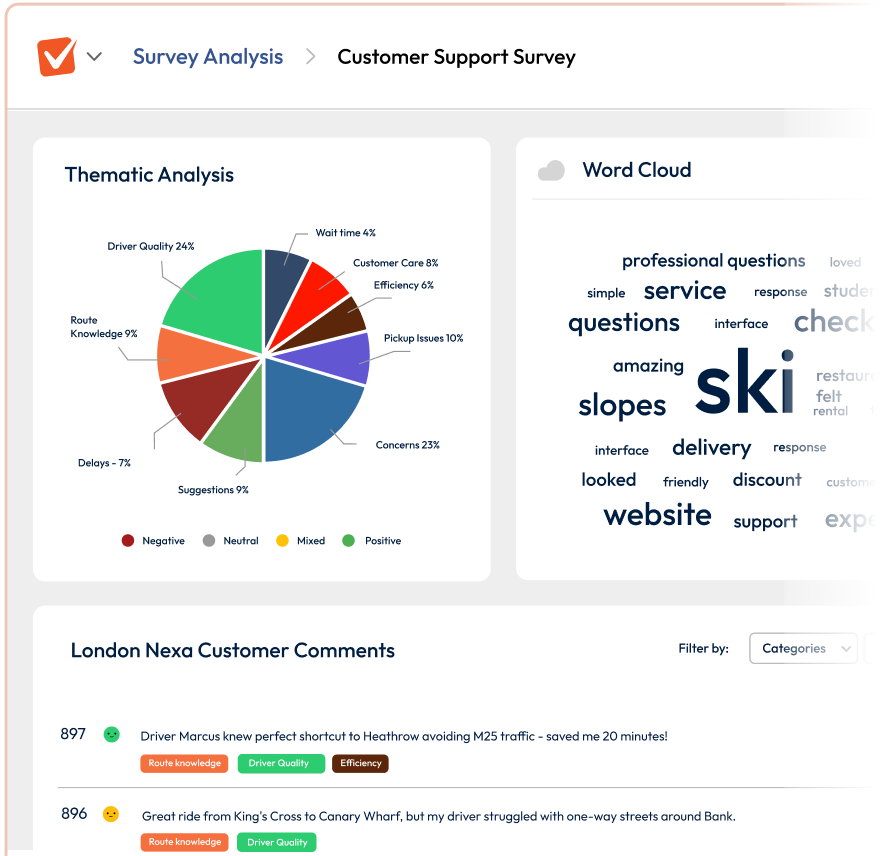
Analyse and understand text data
Text analysis gives you a tool to automatically generate a word cloud based on the frequency of words in responses to free-text questions. See the frequency data in a list or review your responses and apply categories to each one, so your qualitative survey data can be turned into quantitative data you can analyse statistically.
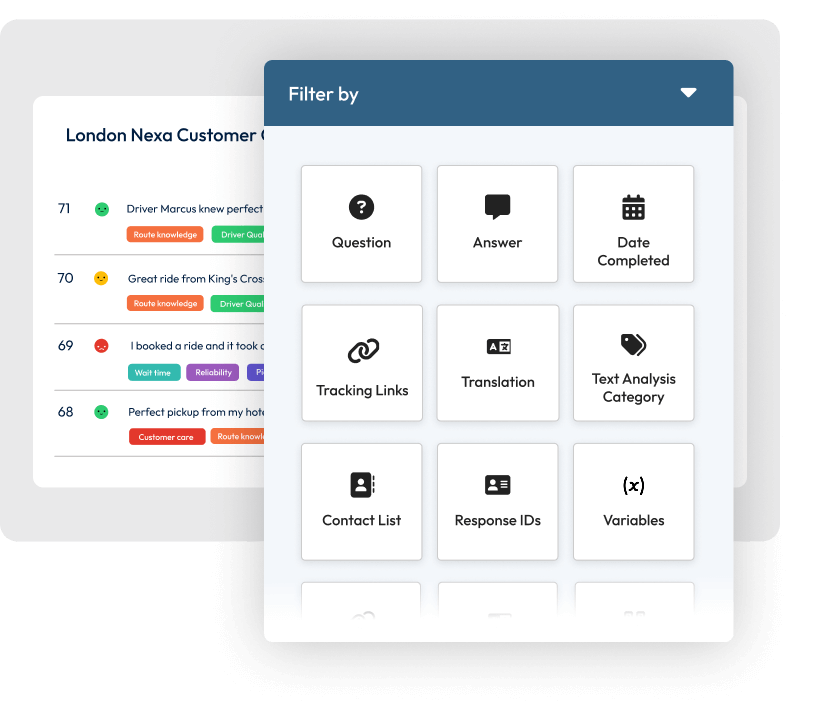
Filter and sort your data
SmartSurvey Filters are hugely flexible and allow you to focus your survey reports and exports on groups you create. Set up rules to include or exclude respondents based on the answers to questions, variable or column data, tracking link, or date/time criteria. Identify key groups and then create custom reports for them.
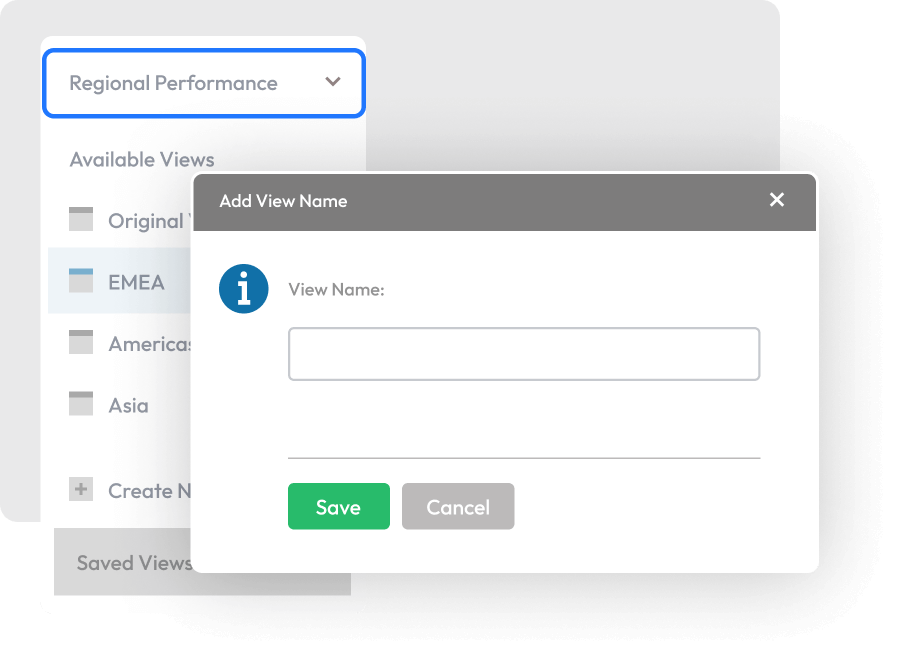
Create custom report views
Views let you customise the main survey data analysis report by including or excluding questions, showing, or hiding elements for free text questions, apply filters and other customisation options. Save your selections for later and switch between them at will. With views, one survey can have as many reports as you need.
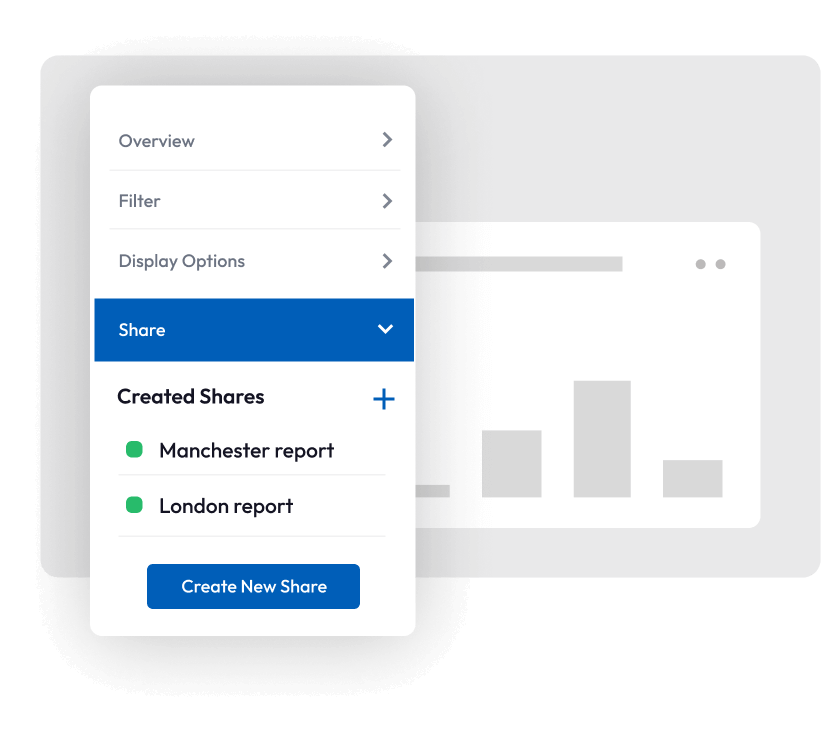
Share summary reports
Once you've created a view, you can create a sharing link to share your custom report with anyone you need to. Add a password to keep your survey analysis secure and brand your reports with a logo and colour theme. Every one of your stakeholders can have the perfect report showing them what they need to see and leaving out anything they don't.
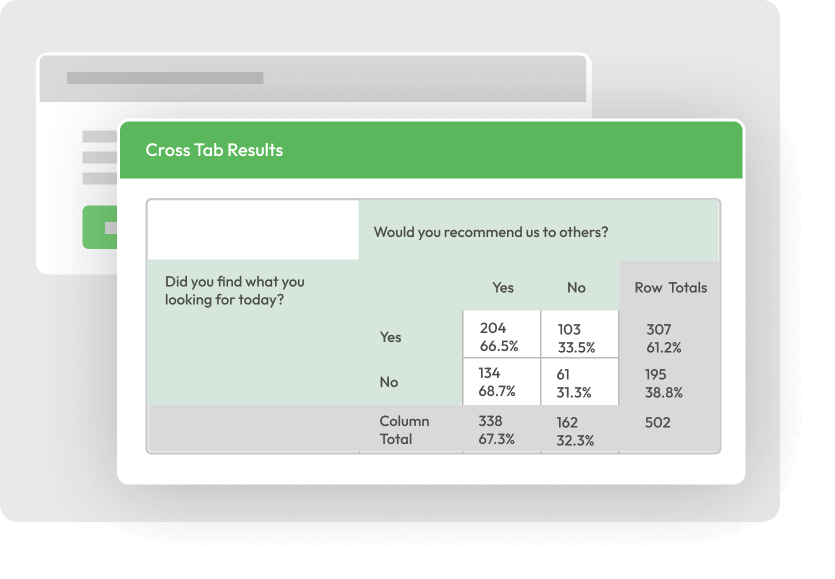
Compare data with cross-tab reports
Crosstab survey data reports make it easy to understand the relationships between how your respondents answer different questions by creating custom tables showing the number of responses for each of the combinations that the two questions can have. By reviewing these, you can quickly identify those key possible correlation factors for reports or further investigation.
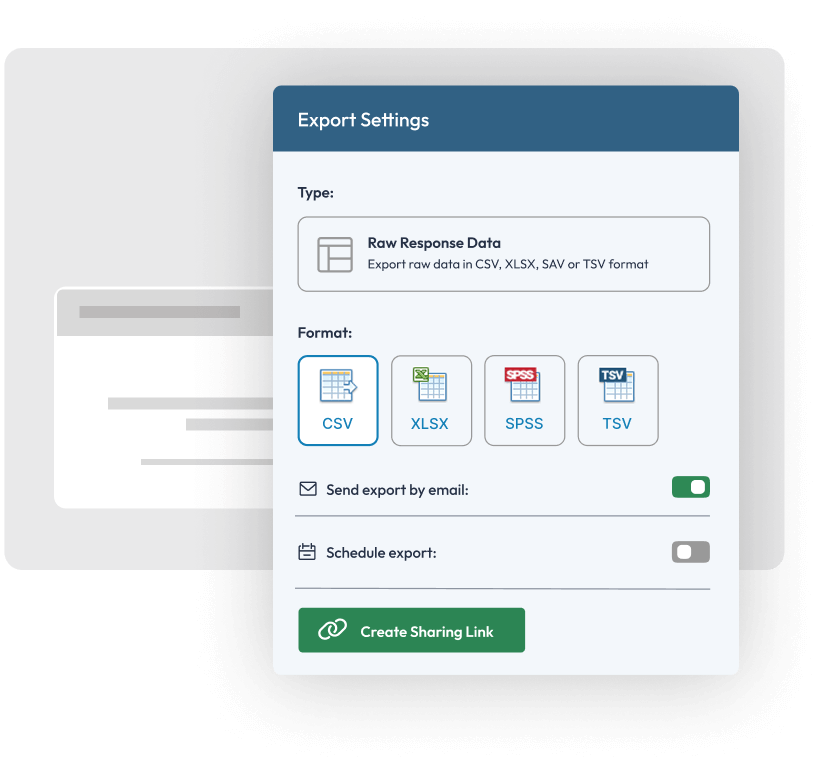
Create and schedule exports
You can export data from SmartSurvey in all the most popular formats, whether that's word/pdf for single response data, XLSX, CSV, TSV, SPSS for bulk responses, or word/excel for a summary report. Create scheduled or recurring exports to automatically run your exports when you need them, and automatically email anyone who needs to be kept informed of your survey metrics.