

SmartSurvey has transformed our ability to present live insights in all levels of the organisation. Our feedback loop is quicker and more effective.

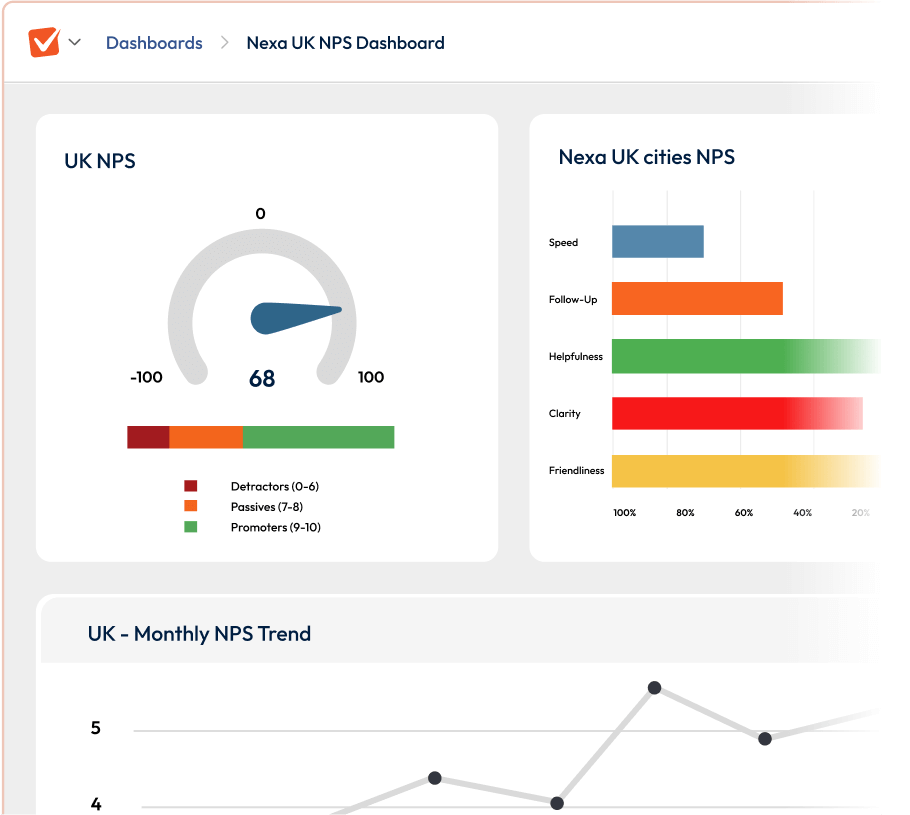


See problems the moment feedback lands meaning no delays, no outdated reports. Act on what’s happening now.
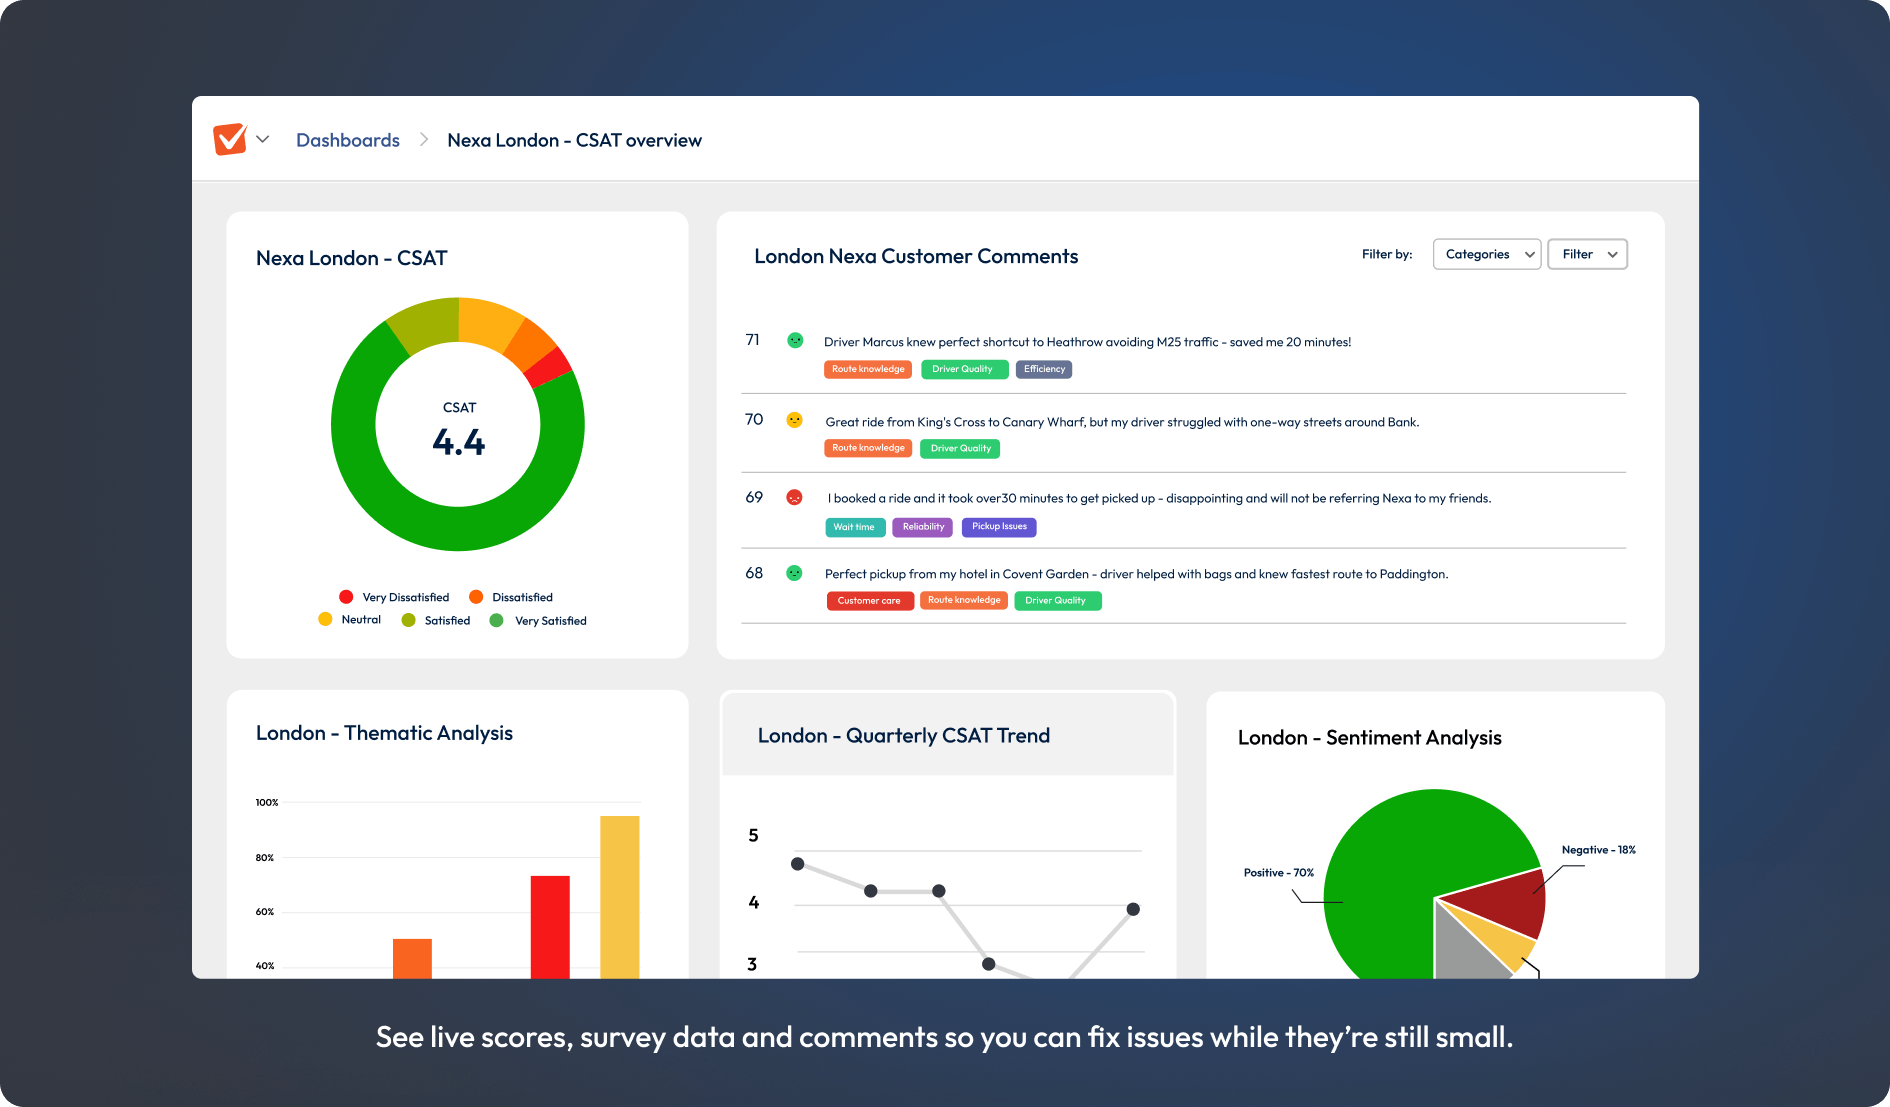
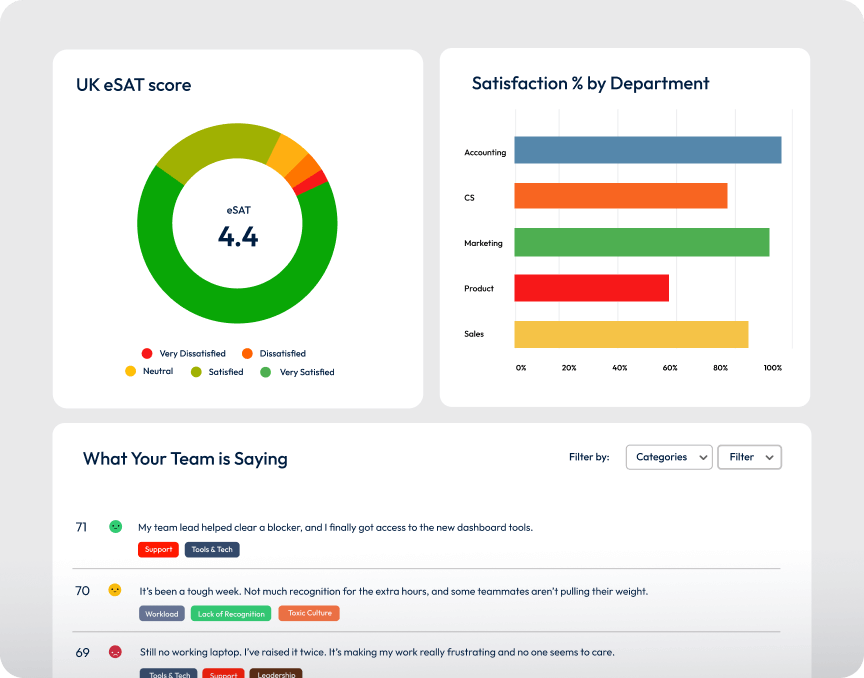
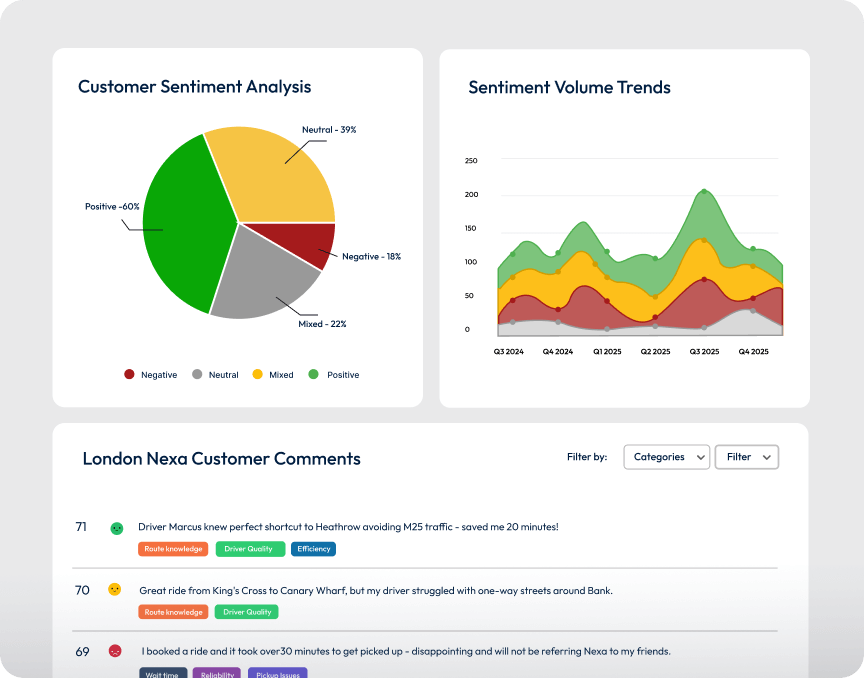
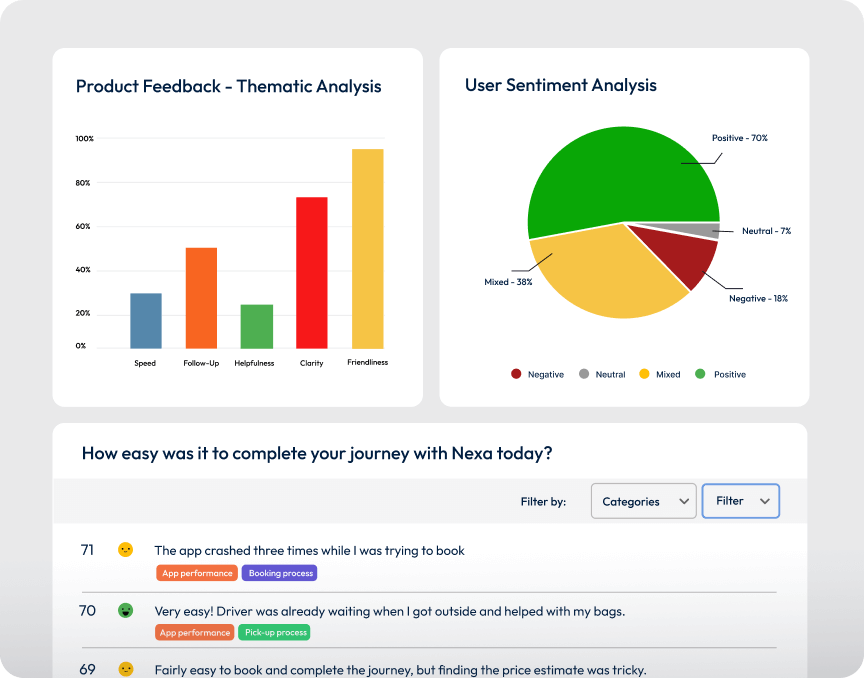
Let AI surface the trends and emotions behind thousands of comments so you can take action faster.
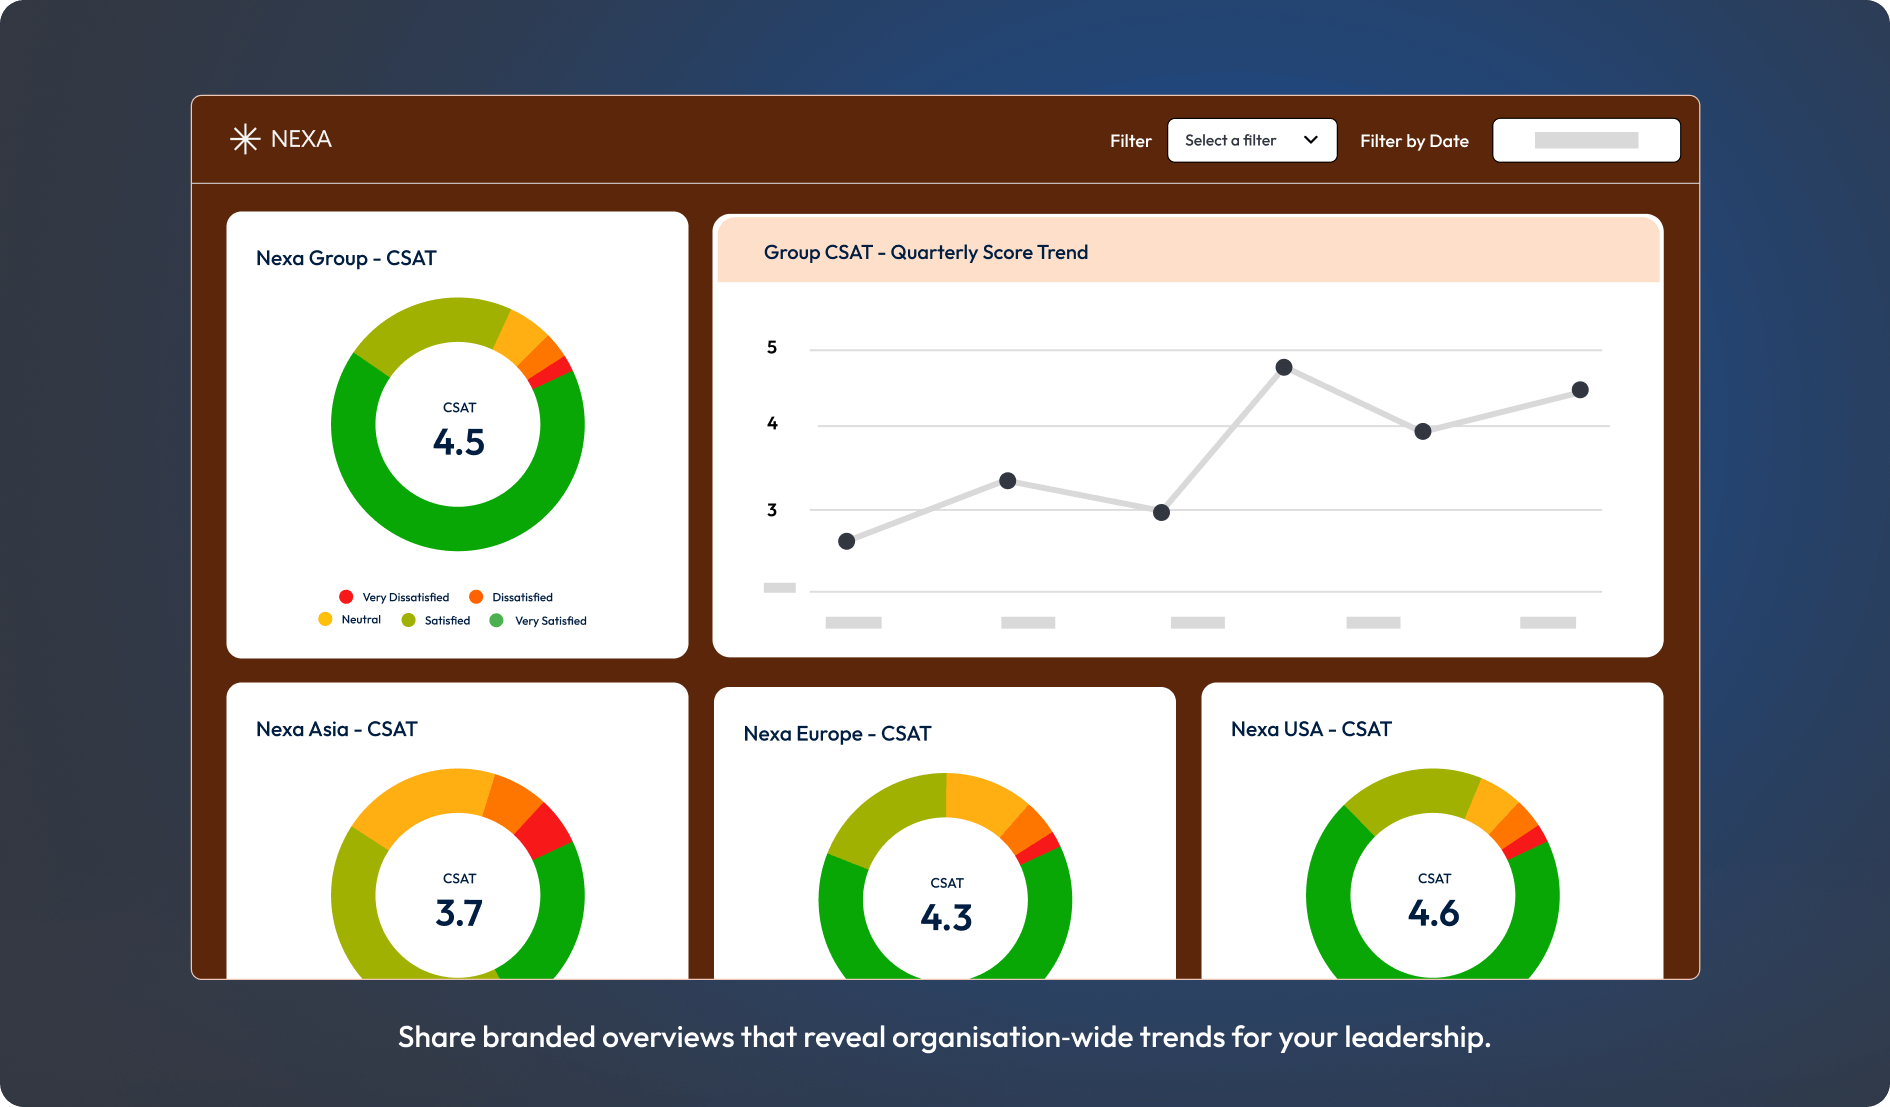
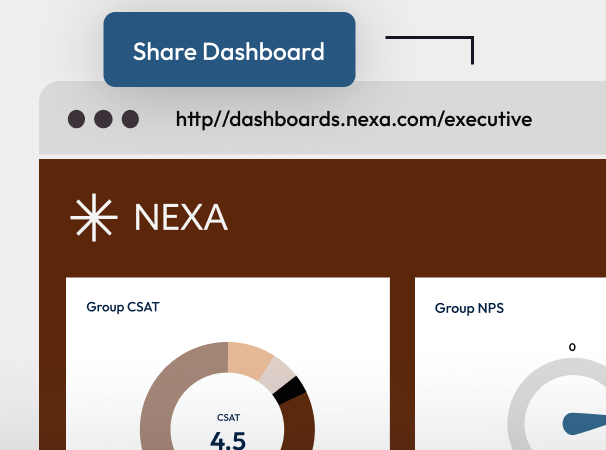
Share live dashboards across all of your teams, so everyone makes data-driven decisions.

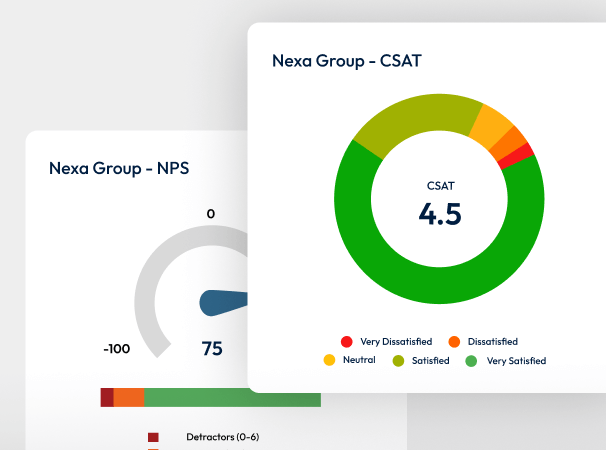
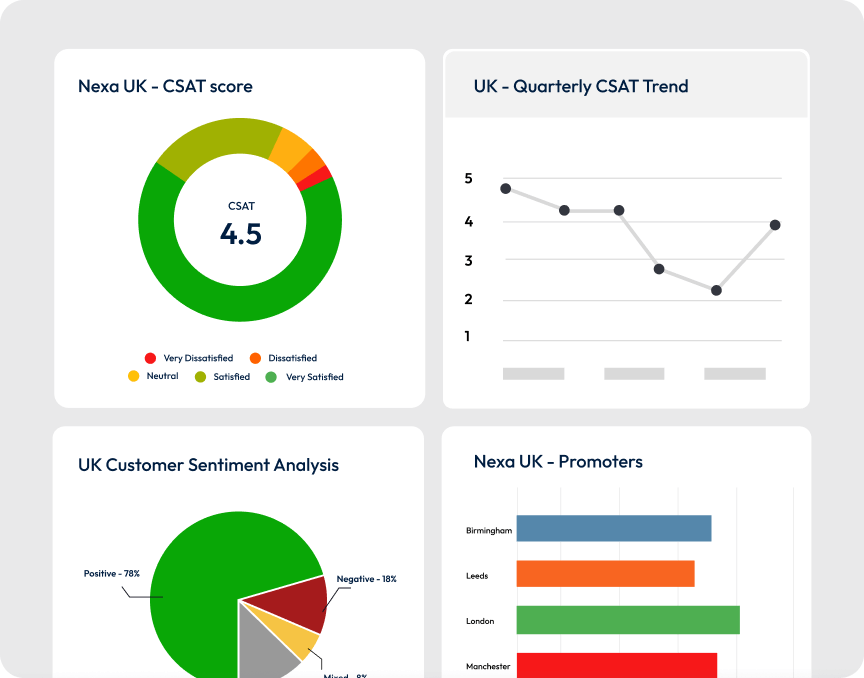
Get the complete picture by comparing results from any survey and styling your dashboards however you like.
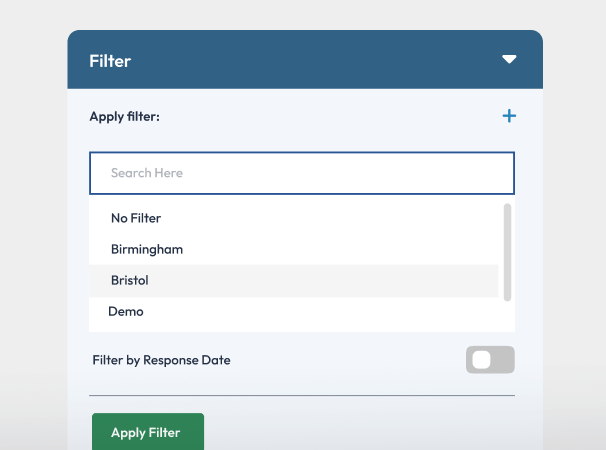
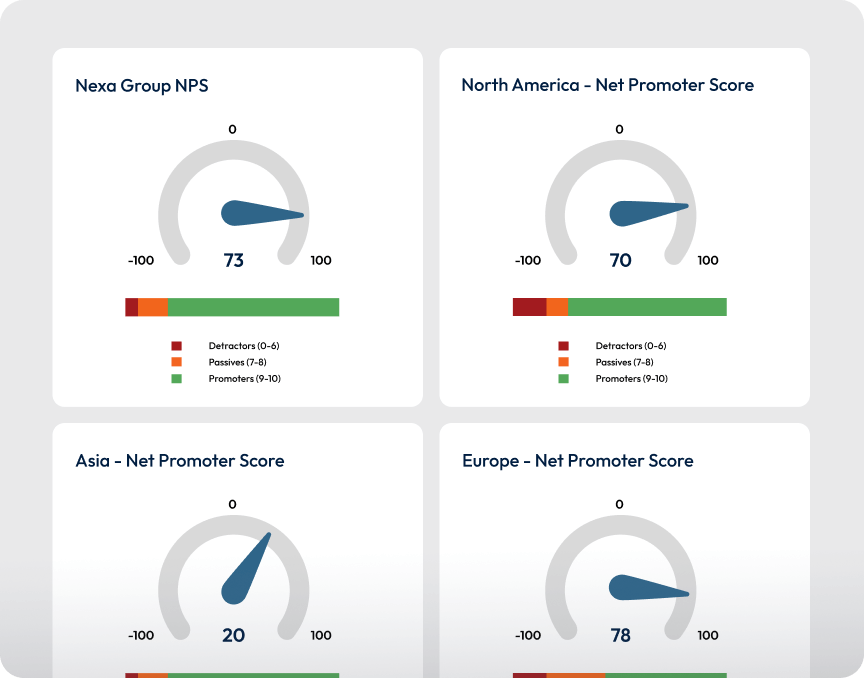
Slice and dice your data instantly by any dimension. One dashboard can have multiple views but without the clutter.
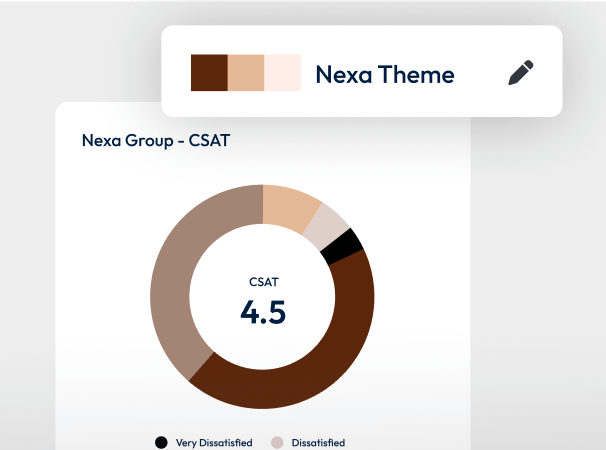
Make insights feel native to your organisation with complete white-label branding that builds instant credibility.
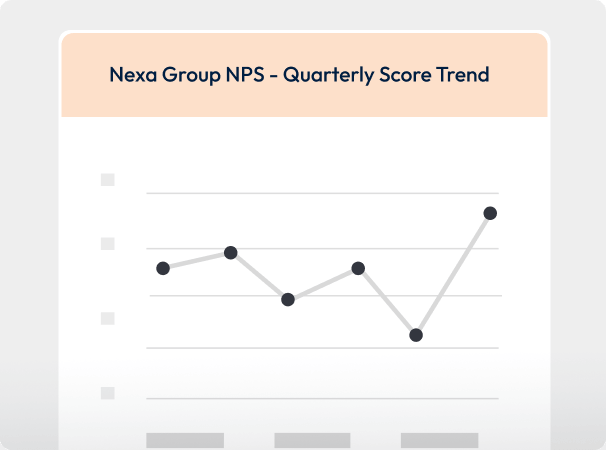
Watch patterns emerge with trend charts that reveal what's really happening in your data over time.
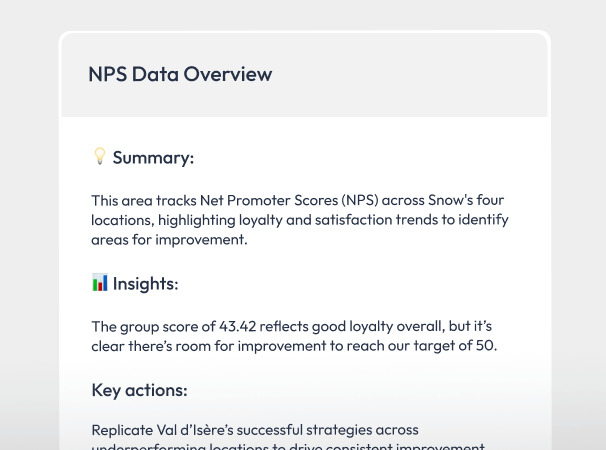
Tell the complete story by adding context, KPIs, and external insights directly within your dashboard.
Share professional insights effortlessly with customisable layouts and branded exports that impress stakeholders.
Instantly surface critical customer insights and urgent issues for service leads.
Keep a continuous pulse on employee engagement insights across every department.
Spot your star branches and flag under-performers then drill into region-specific insights to drive targeted action.
See exactly how customers feel about each agent’s resolution quality and act fast on emerging trends.
Capture feedback and turn user comments into clear priorities for product improvement.
SmartSurvey has transformed our ability to present live insights in all levels of the organisation. Our feedback loop is quicker and more effective.
We couldn't be happier with SmartSurvey, we love its functionality and flexibility. This means we have been able to use one survey tool across many parts of the business.


Help our team understand your current challenges and goals – not a one-size-fits-all pitch.
A tailored walkthrough focused on your goals, your teams, and your challenges.
We’ve shown you how SmartSurvey works - now take it for a test drive with your team.
We don’t disappear after the contract – our team guides your first survey launch step-by-step.

