
Getting the Most Out Of Your Reporting and Analysis Features
Whatever size, or type of organisation you are, having an improved understanding of your stakeholder audience has never been more critical to your success.
While survey feedback can give you that, you still need to understand the key survey stages and tools available to you, if you’re to make the most of your insight. It’s why reports and analysis, is one of the most crucial stages, as it can impact the decisions and actions you take.
We sat down with our in-house Product Specialist, Rich Tysoe, to discuss some of its key features, the benefits they deliver and where appropriate some direction about how to implement them.
When it comes to our reporting and analysis tools, can you offer an outline of some of our typical users and the sorts of issues they require support for?
Broadly I would say our users fall into three main camps, which includes larger organisations, Small to Medium Sized Enterprises (SMEs) and those within academia.
What’s also interesting is that we generally find that different job titles within these groups appear to be responsible for handling survey tasks. And because they tend to be more concerned about different areas, it can influence what they need from us in terms of support.
Large organisations:
With larger organisations for example, we typically see people in relatively more junior roles handling the bulk of survey tasks.
While they tend to take ownership of earlier stage tasks including survey creation, distribution, collection and the presentation of results, they will often pass more of the reporting and analysis tasks onto senior colleagues. This can also involve forwarding data to senior people from outside the business including partner organisations.
Subsequently, we find more junior staff from larger organisations coming to us for extra support to help them through this handover stage. This often sees us helping them with tasks ranging from the exporting of survey results data, to support with report sharing and scheduling.
SMEs:
By contrast, individuals handling survey tasks for SMEs tend to be involved in the whole process. They’ll create and run the survey, look at their results and make decisions themselves based on the insight they see.
With less need to export their data or share it with others, these individuals are typically more focused on internal reporting activities. They’re also more concerned about improvements to actual features and functionality, that will enable them to get even more value from our software.
Academia:
The final group consists of academics and medical research staff.
Given that much of their research is centred around the analysis of large data sets, with the use of SPSS (Statistical Package for the Social Sciences) software, the ability to transfer supporting insight from our survey platform is critical for them.
With our new exporter, it’s now possible to create exports into the right format for direct loading into SPSS. Consequently, it’s issues and questions to do with this feature that they’re more likely to request our support with.
When examining these different groups, the most interesting thing we see is their differing needs. While one group appears to be more interested in what they can do with their data within the SmartSurvey platform, the other’s more concerned about our tools for getting their data out for further analysis by other people or to work with other systems.
Therefore, it makes sense to look at these two areas next.
Ok, with that in mind, could you give us a snapshot of some key features our customers should know about when it comes to analysing their data inside the SmartSurvey platform?
Yes, certainly.
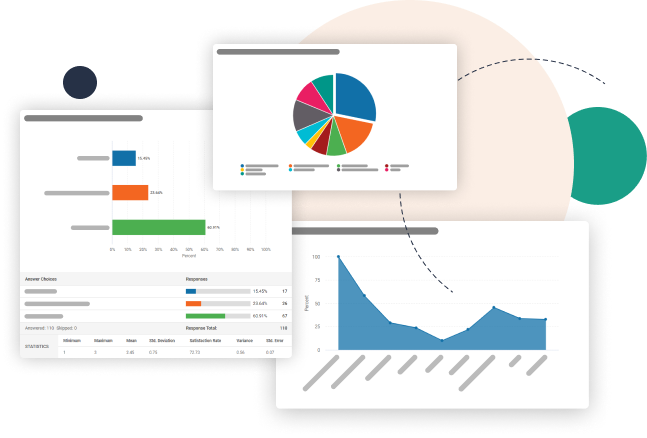
Once users have viewed the aggregated survey data in their summary report and data tables, probably the best place to start next is with charts. Certainly, it’s an area where we’ve made major advancements of late.
Charts:
When it comes to features, charts are probably one of the most important in terms of making your survey findings more understandable, appealing and easier to read.
Whatever mix you choose, whether Bar and Column, or Pie, Line and Area charts, using charts makes it simpler to illustrate patterns and trends in your data. This is particularly beneficial when you’re presenting your findings to others.
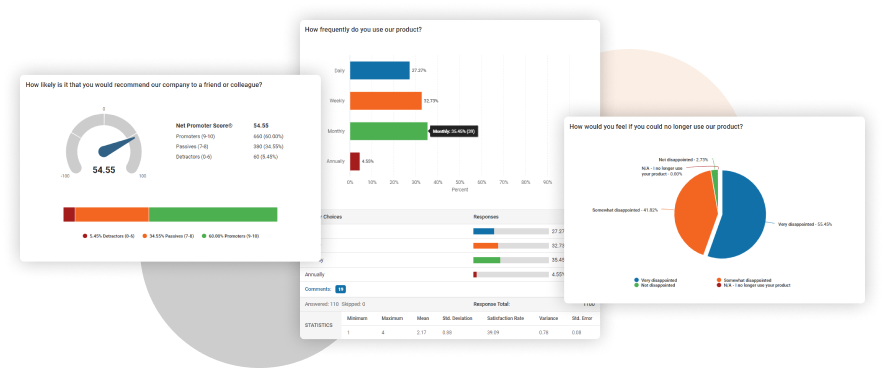
In terms of our own platform, our new charts feature is now a fully integrated part of the summary report and its print-friendly versions.
The new charts feature is also more flexible and customisable than its earlier version.
Not only do users have a greater choice of chart styles, they now have greater control over how the data is presented in each chart too. This makes it even simpler for our users to communicate what they need it to, as clearly as possible.
Groups, segments and cohorts:
Another important part of data analysis process can be the subdivision of data into groups, segments, or cohorts.
This subdivision can be especially beneficial for large data sets, making them easier to sort through and view. More generally it also helps you to make better sense of your data and whether certain factors influence how different groups respond. Whether that’s groups based on specific demographic criteria or groups where members share common characteristics or experiences, such as age bracket or gender.
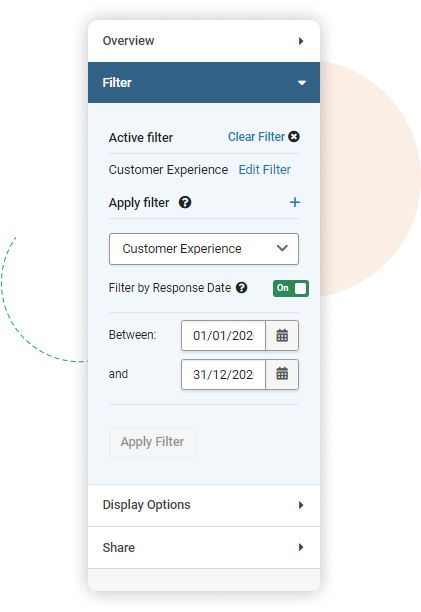
When it comes to analysing data with our own platform, our filtering tool enables a single survey to collect data about a wide array of data subjects and easily split them out into groups for reporting. You can also filter your results in a range of different ways including questions data, contact data, variables, tracking links and much more.
If you’re yet to use, or still relatively new to filtering tools, more help with their implementation can be found in our ‘How to use filtering tools’ help guide.
Views:
Having referenced the summary report earlier, this is another key feature our customers should be using to its fullest. Ultimately, the better your survey results summary the greater it’s impact will be in encouraging more readers to engage with your content. So, you want to make it as good as you can.
Subsequently, to help with that late last year we launched our new ‘Views’ summary report feature.
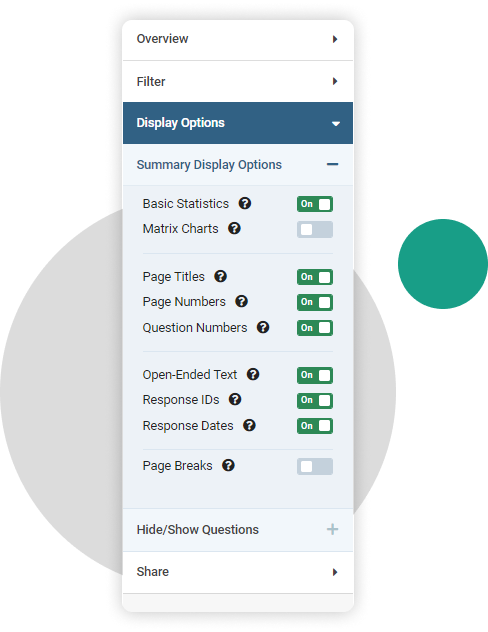
Do more of what you want to
We added a number of new features that give you greater control over how to customise and filter your summary report. These include the ability to activate or deactivate various visual elements such as the display of questions, free text questions, charts and statistical information.
Save your choices
We also made it simple to save your choices, so that once you’ve created your best report, you can save your preferences as a ‘View’.
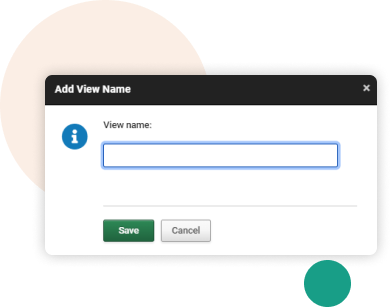
Depending on your requirements, you can save multiple views and switch between them, or set up a default view, so your page always loads how you want it to.
Share views with others
Further customisation is available for sharing your ‘Views’ too, with the ability to create and share a link for each ‘View’.
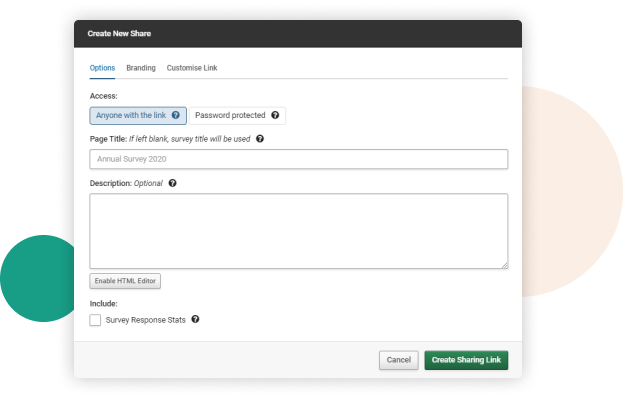
So, if you only want to share part of a survey with someone, you can do that quickly and easily, by sharing a link you’ve created for that particular ‘View’. You can also add a password to keep your data secure.
Subsequently, whoever is given that link and visits it, will see the summary report configured exactly as you’ve set it up in that view.
It’s also worth noting that because you’re linking to a summary report running on live survey data, anyone with access to the results via a sharing link will get those results updated in real time, as responses come in.
If you would like more help with creating a share link for any ‘View’ that you’ve applied to your summary report, you might like to view our ‘Sharing a view via a web link’ guide.
That’s great. Now what about features to help customers that want to get data out of SmartSurvey’s platform, for further analysis by other people, or to work with other systems?
When it comes to support in this area there are a number of features, we can look at. However, probably the best place to start is with the Exporter, as this is what you’ll need to get your data out of the SmartSurvey platform.
The Exporter:
As we stated earlier, there’s a wide range of different users and types of businesses that use our survey software and reporting and analysis tools. Many of them will be running surveys in addition to other research tools and in-house systems that they’re using. Consequently, the ease and flexibility with which they’re able to get their survey data out of our platform will have a huge impact on what they’re able to achieve with their data insights.
Our exporter is yet another one of our tools packed with features and options. Options include the ability to export summarised reports, individual responses in a narrative format, or individual responses in a tabulated format. We also support a wide range of file types including pdf, word, excel, CSV, and SPSS.
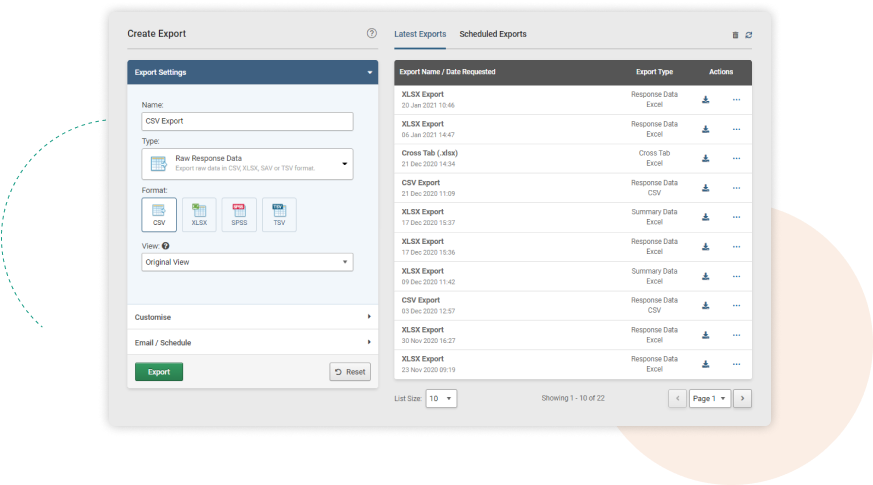
You can apply the same filters as you would set up for the summary report. In addition, there are some quick-access filtering options for dates too. In fact, there’s a lot more options, but too many to cover off in this article.
Once you’ve created a report, you can quickly re-run it at any time in the future without having to configure it again – you can also modify the configuration before doing so. In addition, you can automatically send a completed report to an email address.
For help with setting up a basic export this you might like to take a look at our ‘Exporting and Sharing Results’ help guide.
Scheduler:
Keeping on the theme of exporting data, you can save yourself a lot of time with our Scheduler. This will allow you to create scheduled exports that will run at a specified point in the future.
Thanks to a fantastic new feature we’ve added, you can also use the scheduler and the relative date filters to create recurring reports that move forward through time. So, you could for example, send the most recent 14 days’ worth of responses every two weeks. In addition, as with any other scheduled export, you can set this to be sent out as an automated email each time it runs.
Another benefit of the Scheduler is that you can even make further edits or copy your data exporting report after it’s been scheduled.
If you’ve not used our Scheduler before, but would like to find out more about implementing it, you might like to visit our ‘Schedule Export Options’ page.
Automate workflows:
While the Exporter and Scheduler tools offer a more manual way of getting your data out, there are more automated methods you can use. However, these will require more coding and setup work by you on the receiving end.
Webhooks
When we refer to webhooks, we are essentially referring to a one-way integration of SmartSurvey data to an endpoint, which processes the data. It can also be thought of as an automatic export for every response, which will automatically fire as soon as that response is completed. So, you could for example, take information collected via a SmartSurvey survey or form and add it to your CRM database.
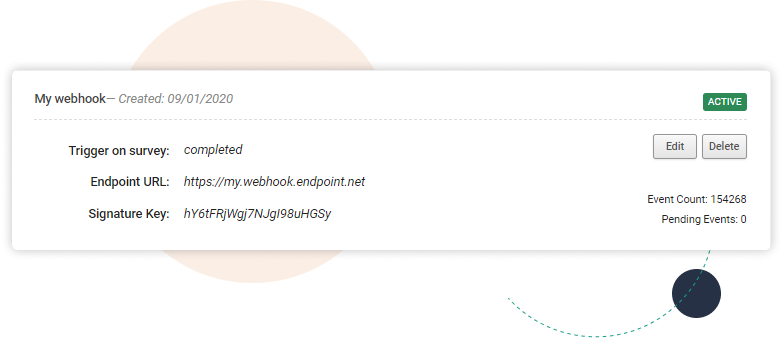
You will need to code or configure the endpoint, which can be a proprietary system or something like google sheets or Sharepoint.
However, having webhooks in place can save teams a lot of time and effort, as it provides real-time data updates whenever there’s fresh activity.
APIs
Complementing the functionality of webhooks is the API.
While webhooks are focused on one-way data flow, the API offers a two-way data flow, where besides receiving data, programs or apps can send their own requests for data to SmartSurvey.
From creating, deleting or copying surveys and contact lists, to generating new tracking links for your online surveys, adding fresh subscribers, downloading exports and much more. It’s possible via API requests to do much more.
On the SmartSurvey side, it’s easy to set up an API, it’s just a case of creating an API key. However, on your client side there will be more work to determine what you want to request and do with it when it returns. But by doing so you can create highly effective integrations that do exactly what you need them to.
For more support with setting up webhooks or APIs you might like to read our ‘API and Webhooks’ help page.

Neil has a deep understanding of software and how to bring its value to market. With experience across Human Capital Management, Learning & Development, AI-powered platforms and omnichannel communications, he knows what it takes to connect solutions with real business needs. Neil’s passionate about helping organisations turn insight into action and elevate the customer experience.

