
Net Promoter Score: How to Launch, and Optimise Your Loyalty Programme

Net Promoter Score guide and calculations
There are dozens of metrics that try to offer insight into customer experience and preferences. Net promoter score (NPS) is perhaps the gold standard. Calculating your NPS requires careful calculation, but when done properly, it’s one of the best tools for understanding what your customers experienced in their latest interaction with your company. Specifically, NPS provides you with clarity on whether that customer would recommend your business to others.

In this guide, we’ll explain net promoter score (NPS), including the formula, calculations, and the ideal NPS benchmarks. You’ll also learn how to structure a survey to help you automate the process of capturing these critical figures.
How to conduct an effective NPS survey
Conducting an effective NPS survey is one of the most important strategies for your business. It provides insight into your customers' loyalty and advocacy and is, therefore, an essential marketing development process. We’ll discuss NPS surveys in detail in a moment, but you can start the process as soon as now.
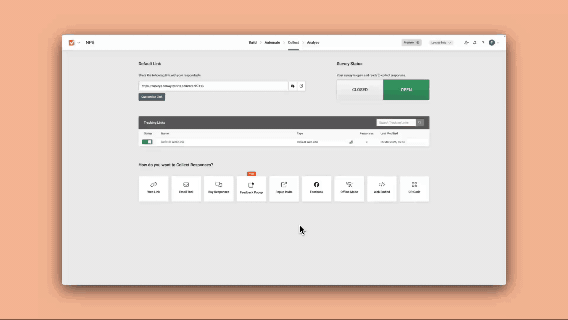
It may not seem difficult to create and launch such a survey. However, using software like SmartSurvey makes the entire process more accurate and efficient.
With SmartSurvey, you have three ways to create an NPS survey:
- You can let AI generate the survey for you.
- You can use one of the pre-built templates that we have available.
- You can create a custom survey from scratch.
One of the questions in your survey is the NPS question, which is customized to fit your survey topic. SmartSurvey's intuitive design makes any one of these three steps efficient.
You can also add additional elements to the survey to give you more insight. For example, follow-up open-ended questions may provide insights into the “why” behind the score. You can also use it with branching logic. That is, the answer to their question guides them into deeper branches of the survey or takes them to the end.
Survey distribution methods
Now that your survey is ready to go, you’ll need to launch it. SmartSurvey makes it possible for you to distribute your score in several ways:
- On your website, using a pop-up, widget, or embedded link
- SMS (texting the survey to your customer)
- API for automated feedback loops
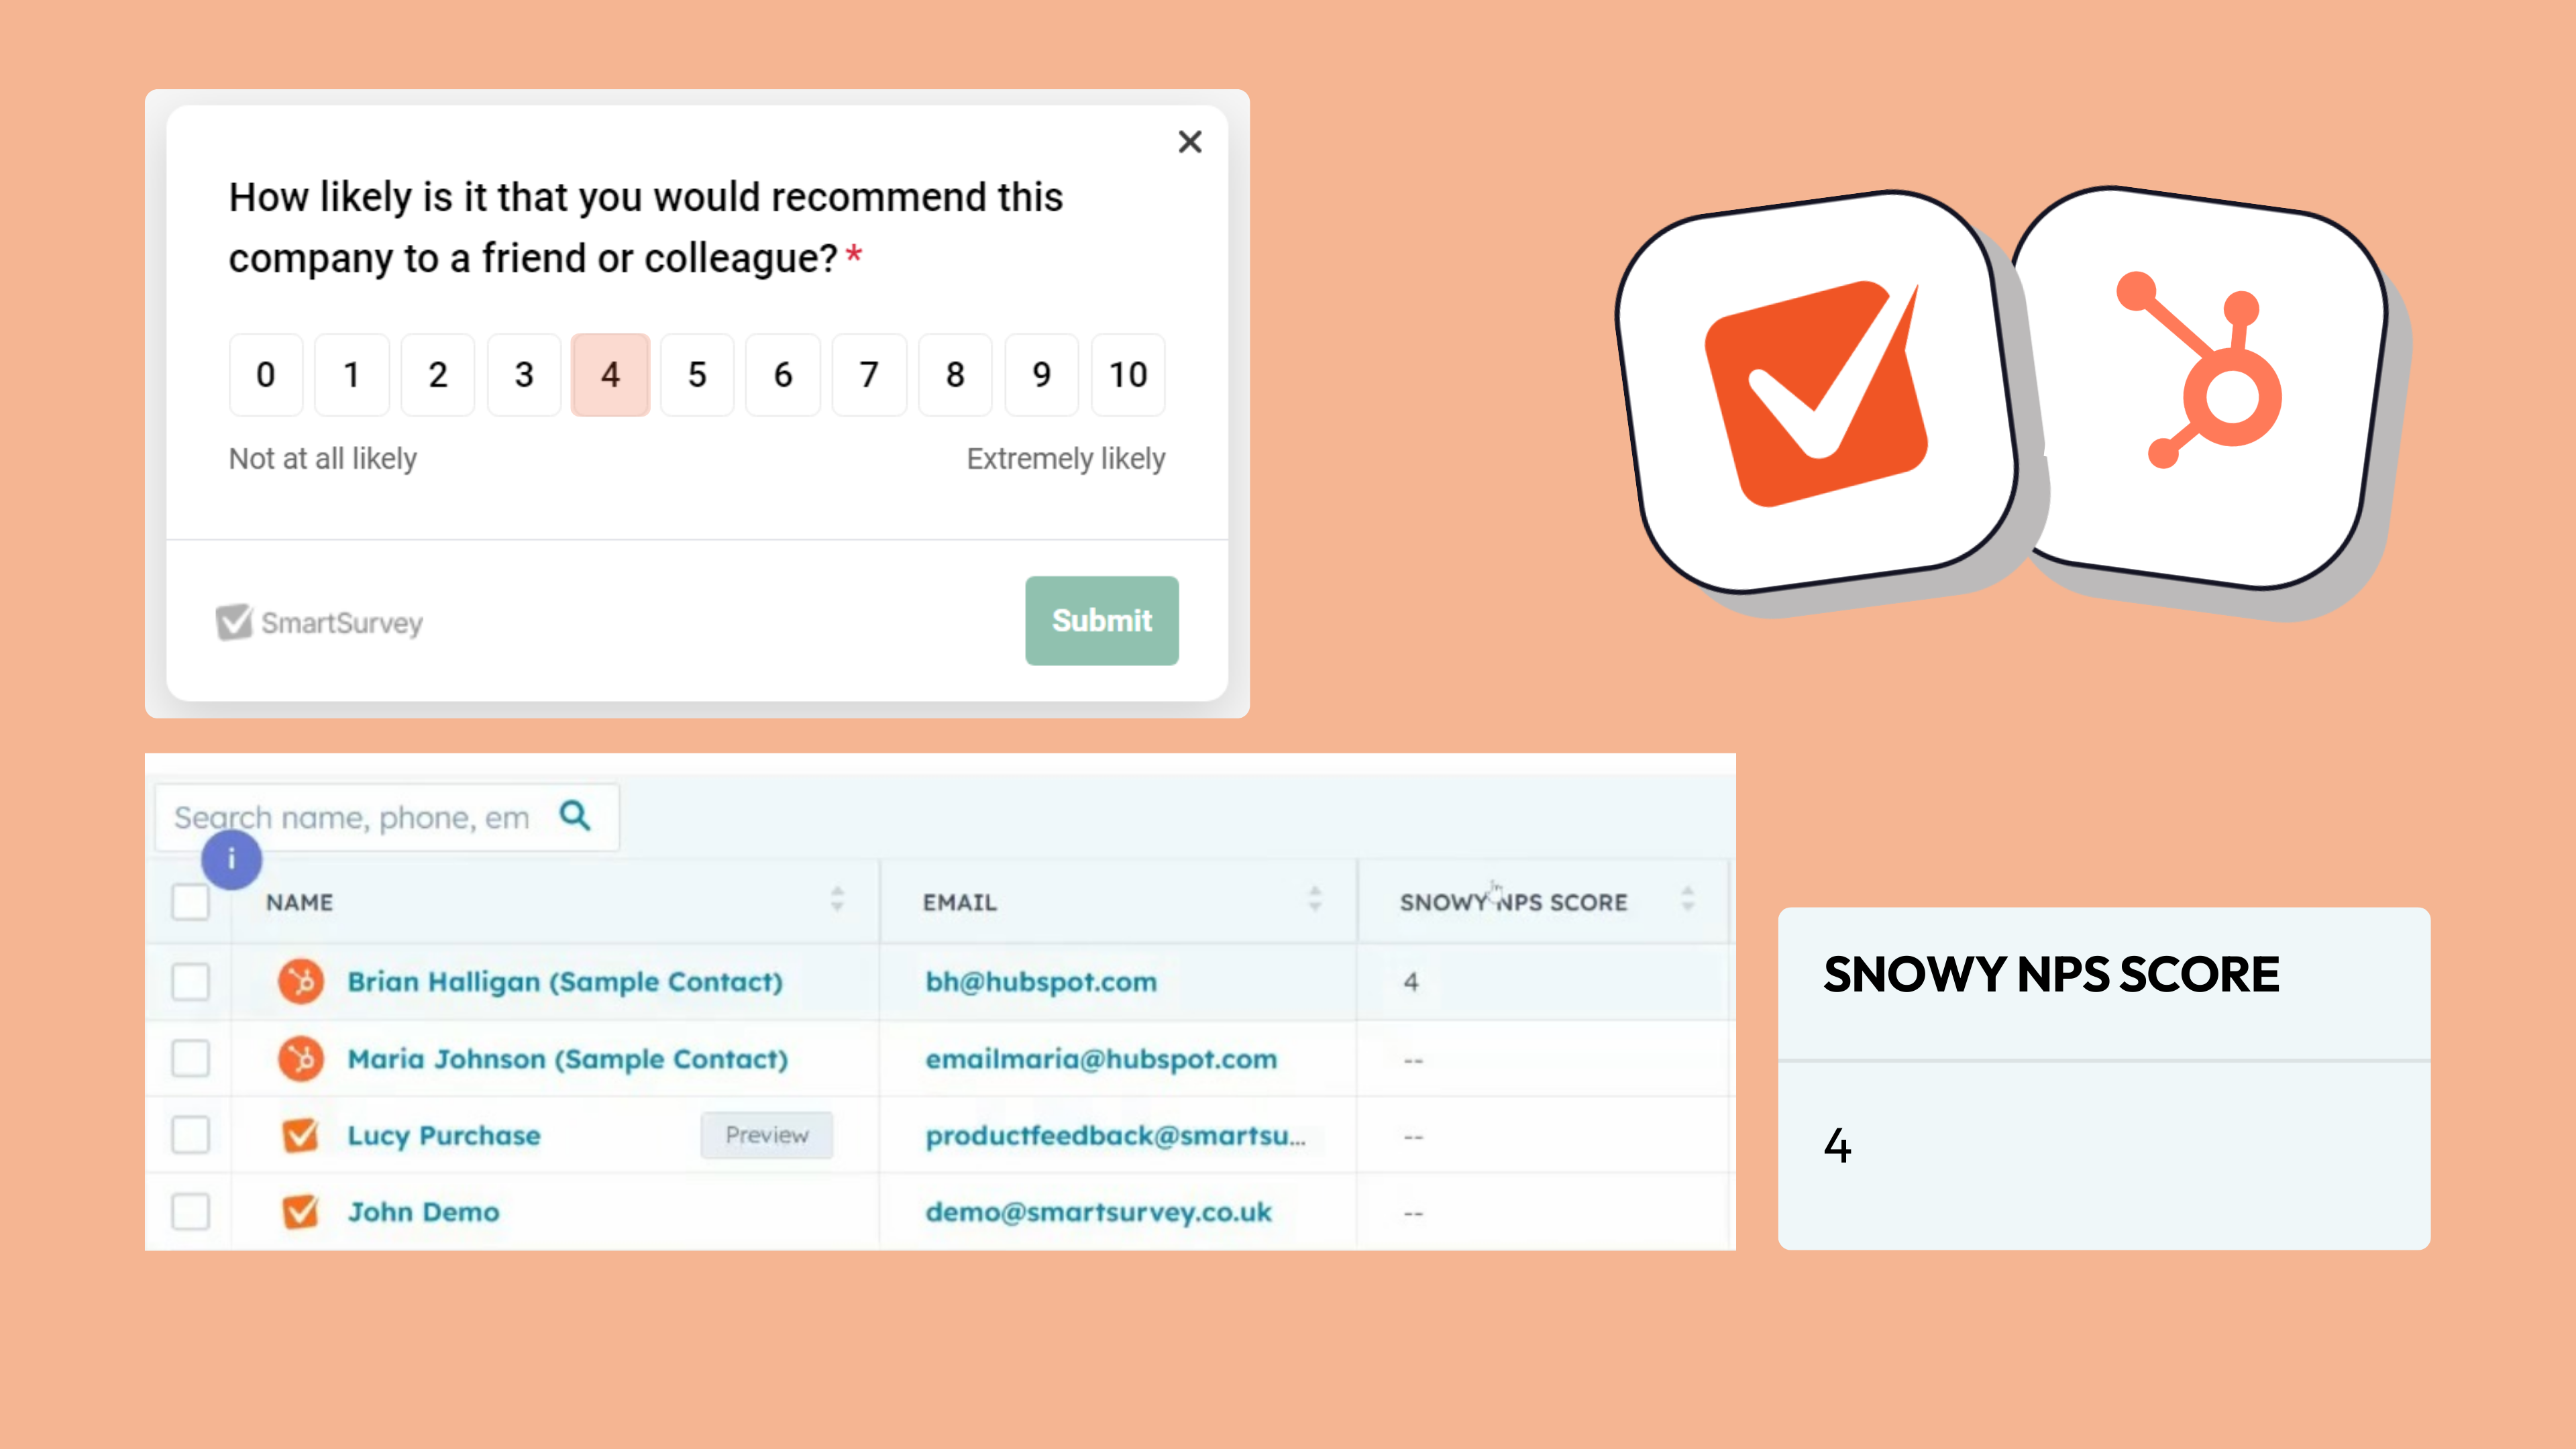
You can also integrate NPS with your current business systems. For example, you can link your NPS survey to your CRM (with most CRMs supported, including HubSpot and Salesforce). You can also automate a variety of components of this process to truly make it hands-free in terms of the amount of work you need to do to get your score into your customer’s hands.
What to do after you receive your data
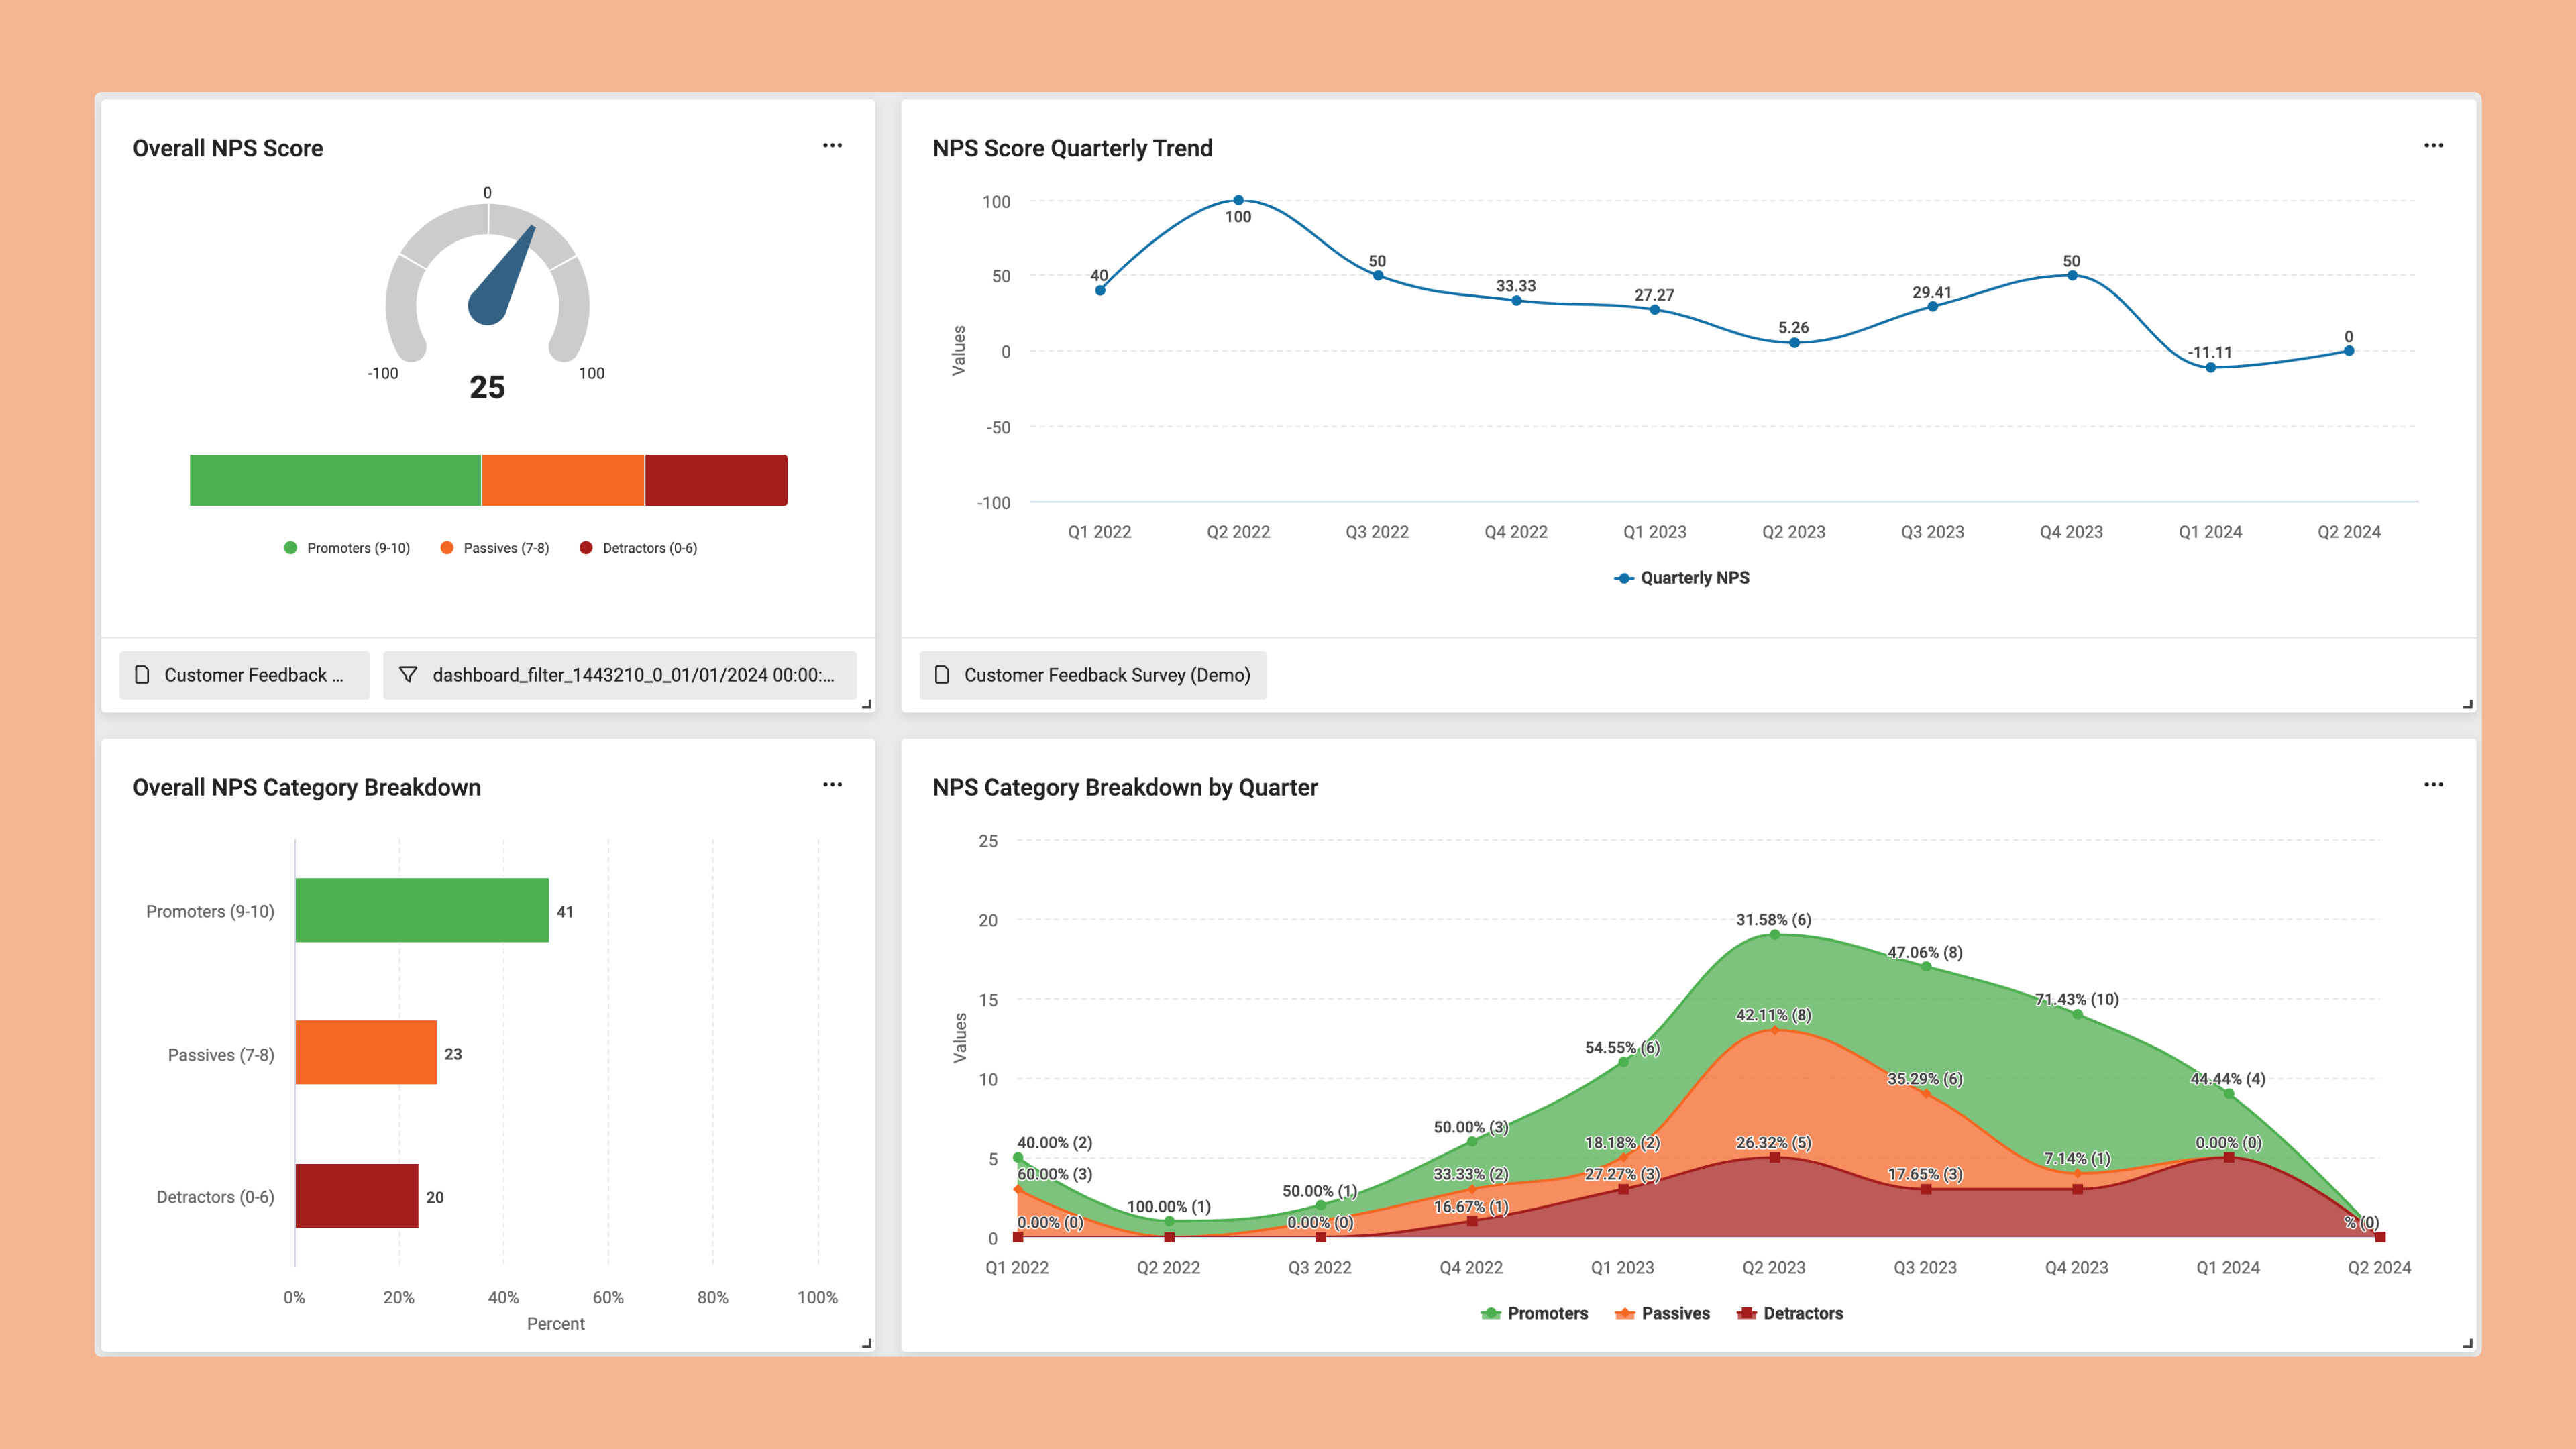
NPS surveys with SmartSurvey provide real-time reporting and analytics. They track trends in your NPS over time and alert you to substantial changes. You can also filter and segment your survey data based on a specific demographic or customer group.
Take your data, then, and implement it into dashboards. This enables you to have a visual representation of NPS data. If you’re using tools like Tableau, Power Bi, or other business intelligence features, you can export your data to them. It’s also possible to structure your dashboard for various teams.
Not all customer service NPS score tools work the same way. However, our net promoter system is highly efficient and intuitive, requiring little time to set up and utilize.
The details: what is Net Promoter Score and why does it matter?
Let’s take a step back with the definition of the net promoter score. It is a commonly used metric to measure customer experience by measuring customer loyalty. Specifically, it considers how likely a customer is to recommend the business to another person.
NPS is measured using a single-question survey. Your NPS score ranges from -100 to +100. Aiming for a higher score is ideal, as it indicates that customers are more likely to recommend your business to others.
NPS isn’t a new tool. In fact, it’s been around for over 20 years. Today, it’s used by millions of companies to create an accurate and efficient way to track customer loyalty.
Maintaining happy customers is always beneficial to your company – you know that. But, you also want to ensure those happy customers are going out and telling others about your service.
We all know that people like to complain and will tell the world about a bad experience. However, understanding what they would do with a positive experience can be quite helpful to your company. So, why does net promoter score matter?
- It measures customer satisfaction. Are your customers likely to recommend you to someone else?
- The NPS score can help predict growth and revenue increase due to a strong customer base.
- NPS allows you to make data-driven decisions about how to manage your company’s customer experience.
- You can also use your NPS score as a way to gauge how well you’re competing against your competitors.
- Most importantly, NPS scores give you a way to prioritize your customers’ satisfaction.
No matter how fantastic your product is, if your customer service is bad, that’s going to hurt future growth. If your product blows your customer out of the water with how fantastic it works, that’s going to impact your business, too. NPS is a valuable metric that applies to most companies. Let’s dive in to see how it all works.
NPS is about loyalty.
It’s not just about customer service, but:
- Product success: Are customers happy enough with features and offerings to recommend them?
- Brand success: Do people feel loyal to the brand overall so much that they would recommend it?
- Customer journey success: Would someone recommend the onboarding experience they received to their colleagues?
- Support team success: Would customers tell others about the fantastic help they received from your service team?
- Renewal process success: Are your customers likely to tell others about how easy and worthwhile it is to renew their service with you?
The bottom line? If one of these areas isn’t on point, no one is going to recommend your business to their employees, customers, friends, or family. That’s a costly loss.
With NPS, we can capture those feelings, thoughts, and experiences in a very direct manner. That allows every component of your business – from customer experience teams, marketing teams, and product developers, to know whether what they are doing is the ideal solution or not, so much so.
How the Net Promoter Score calculation works
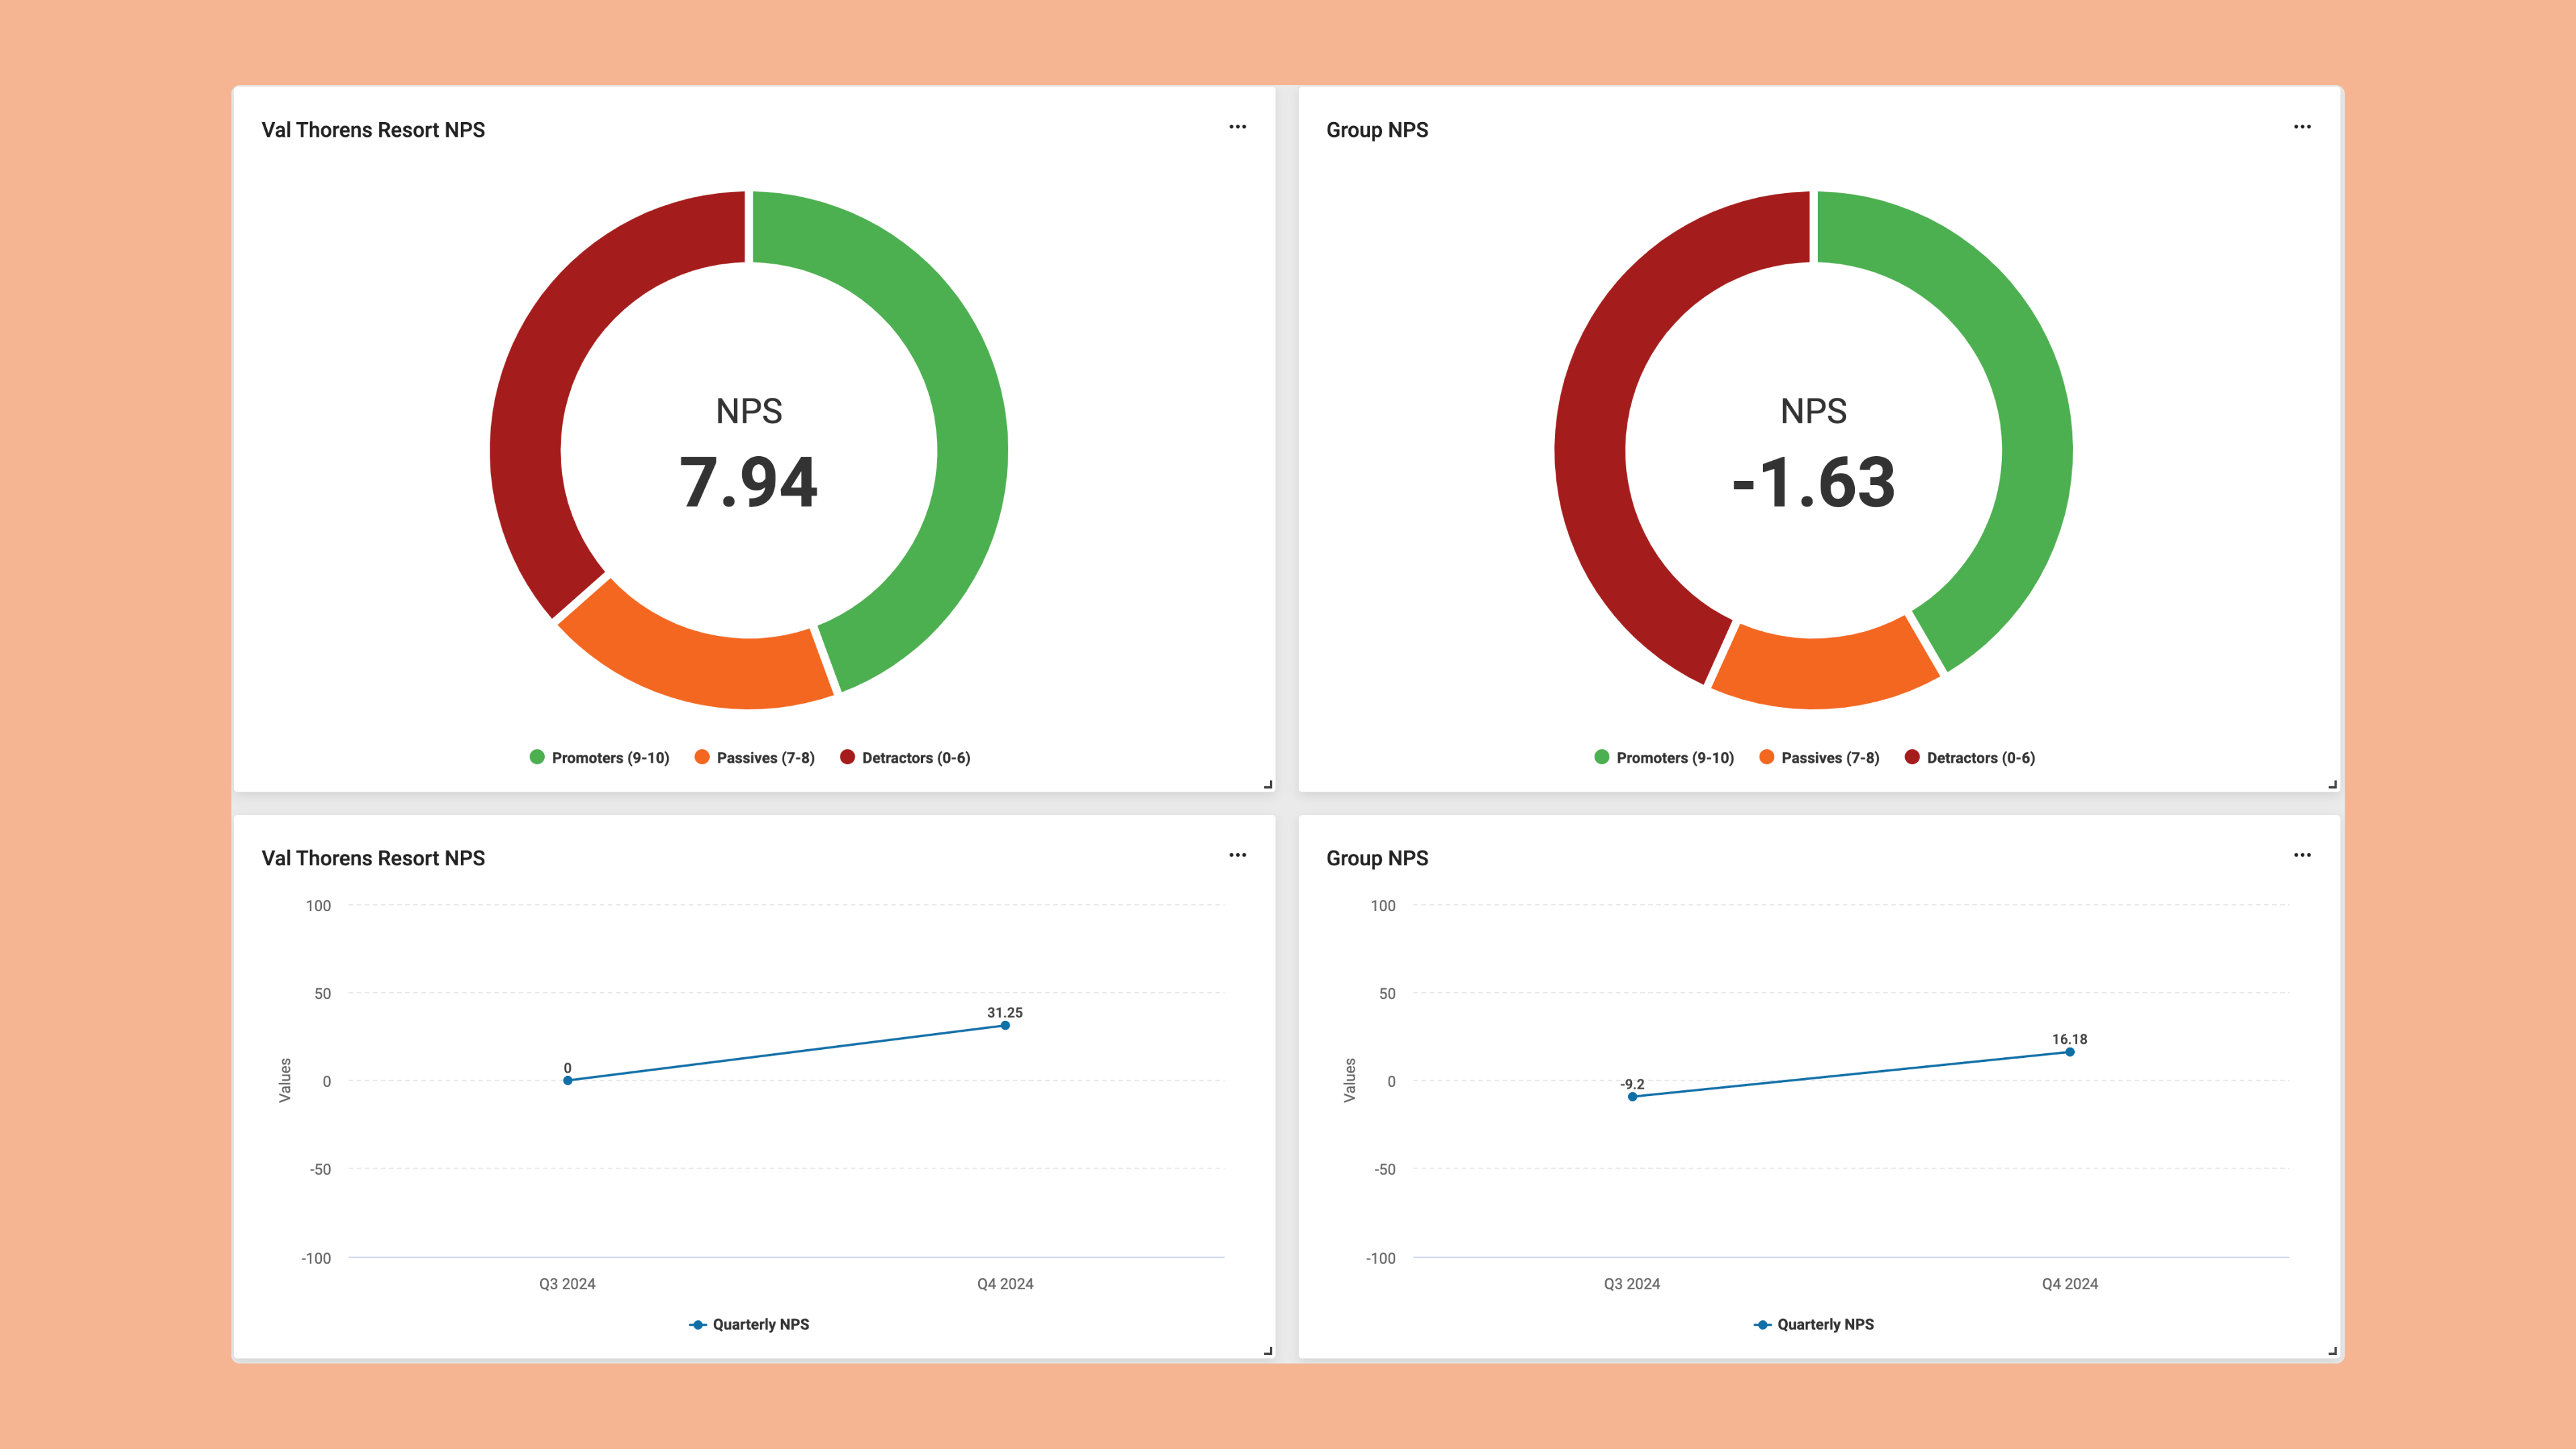
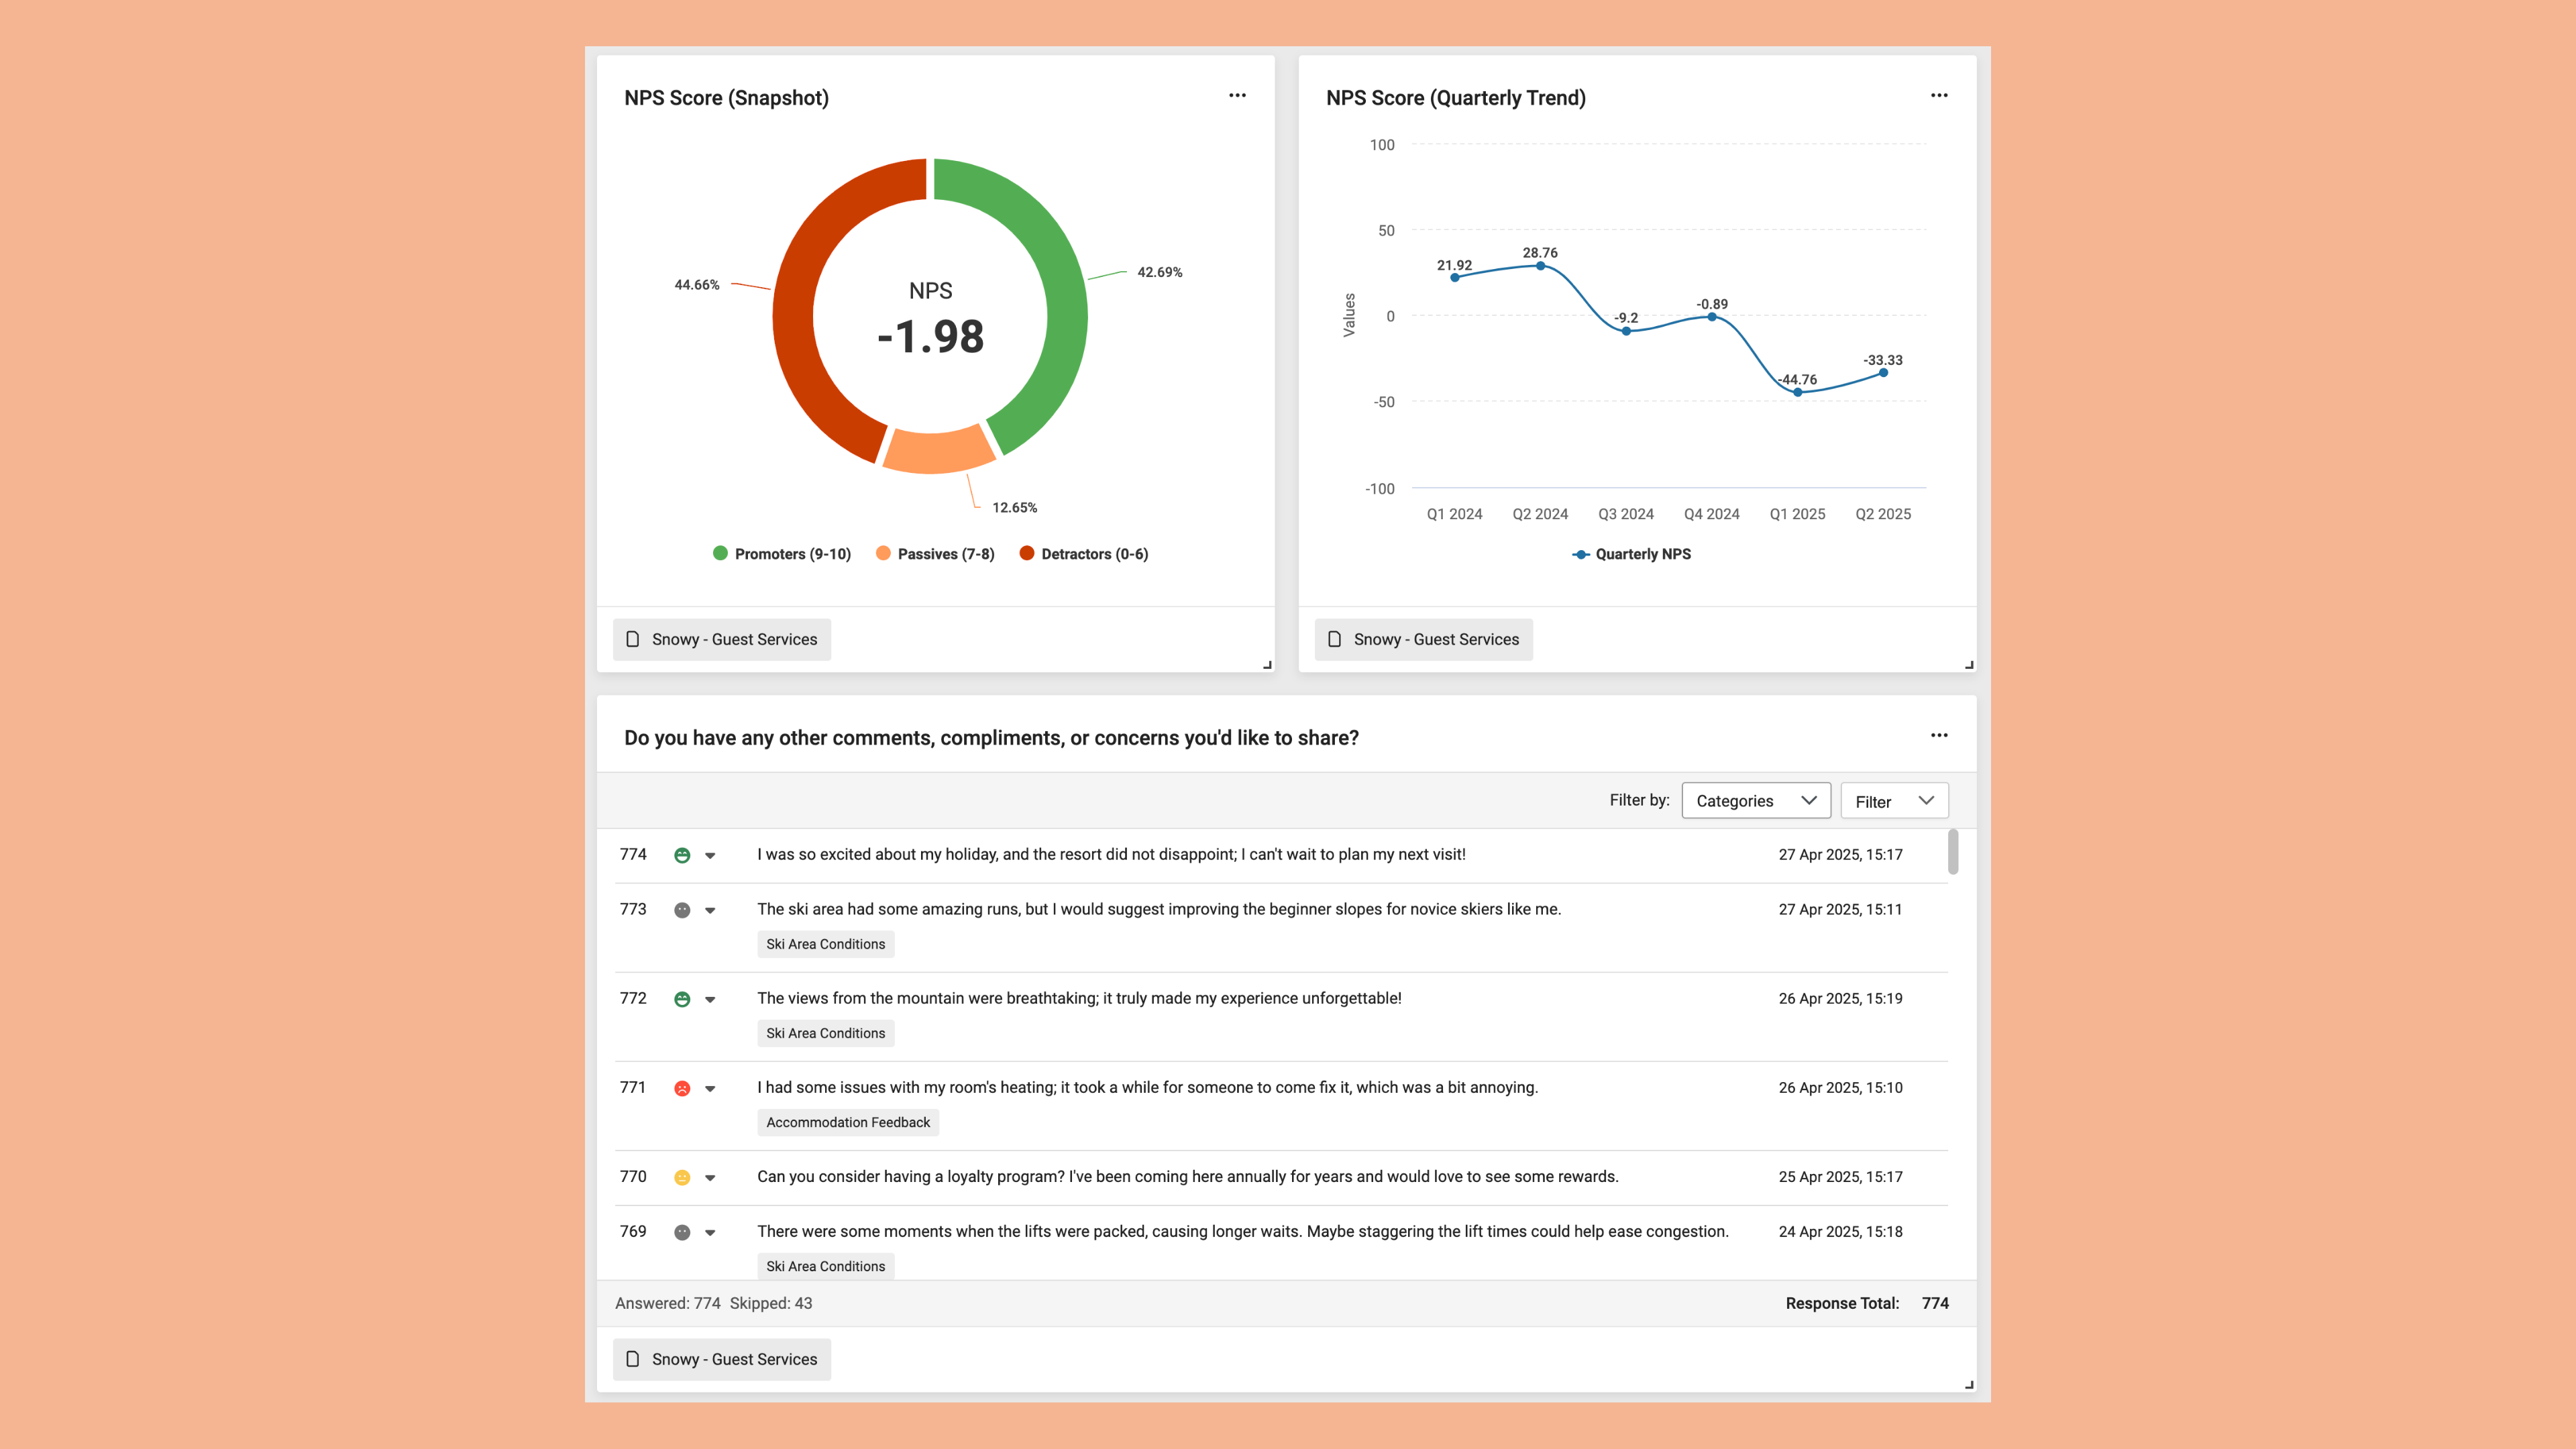
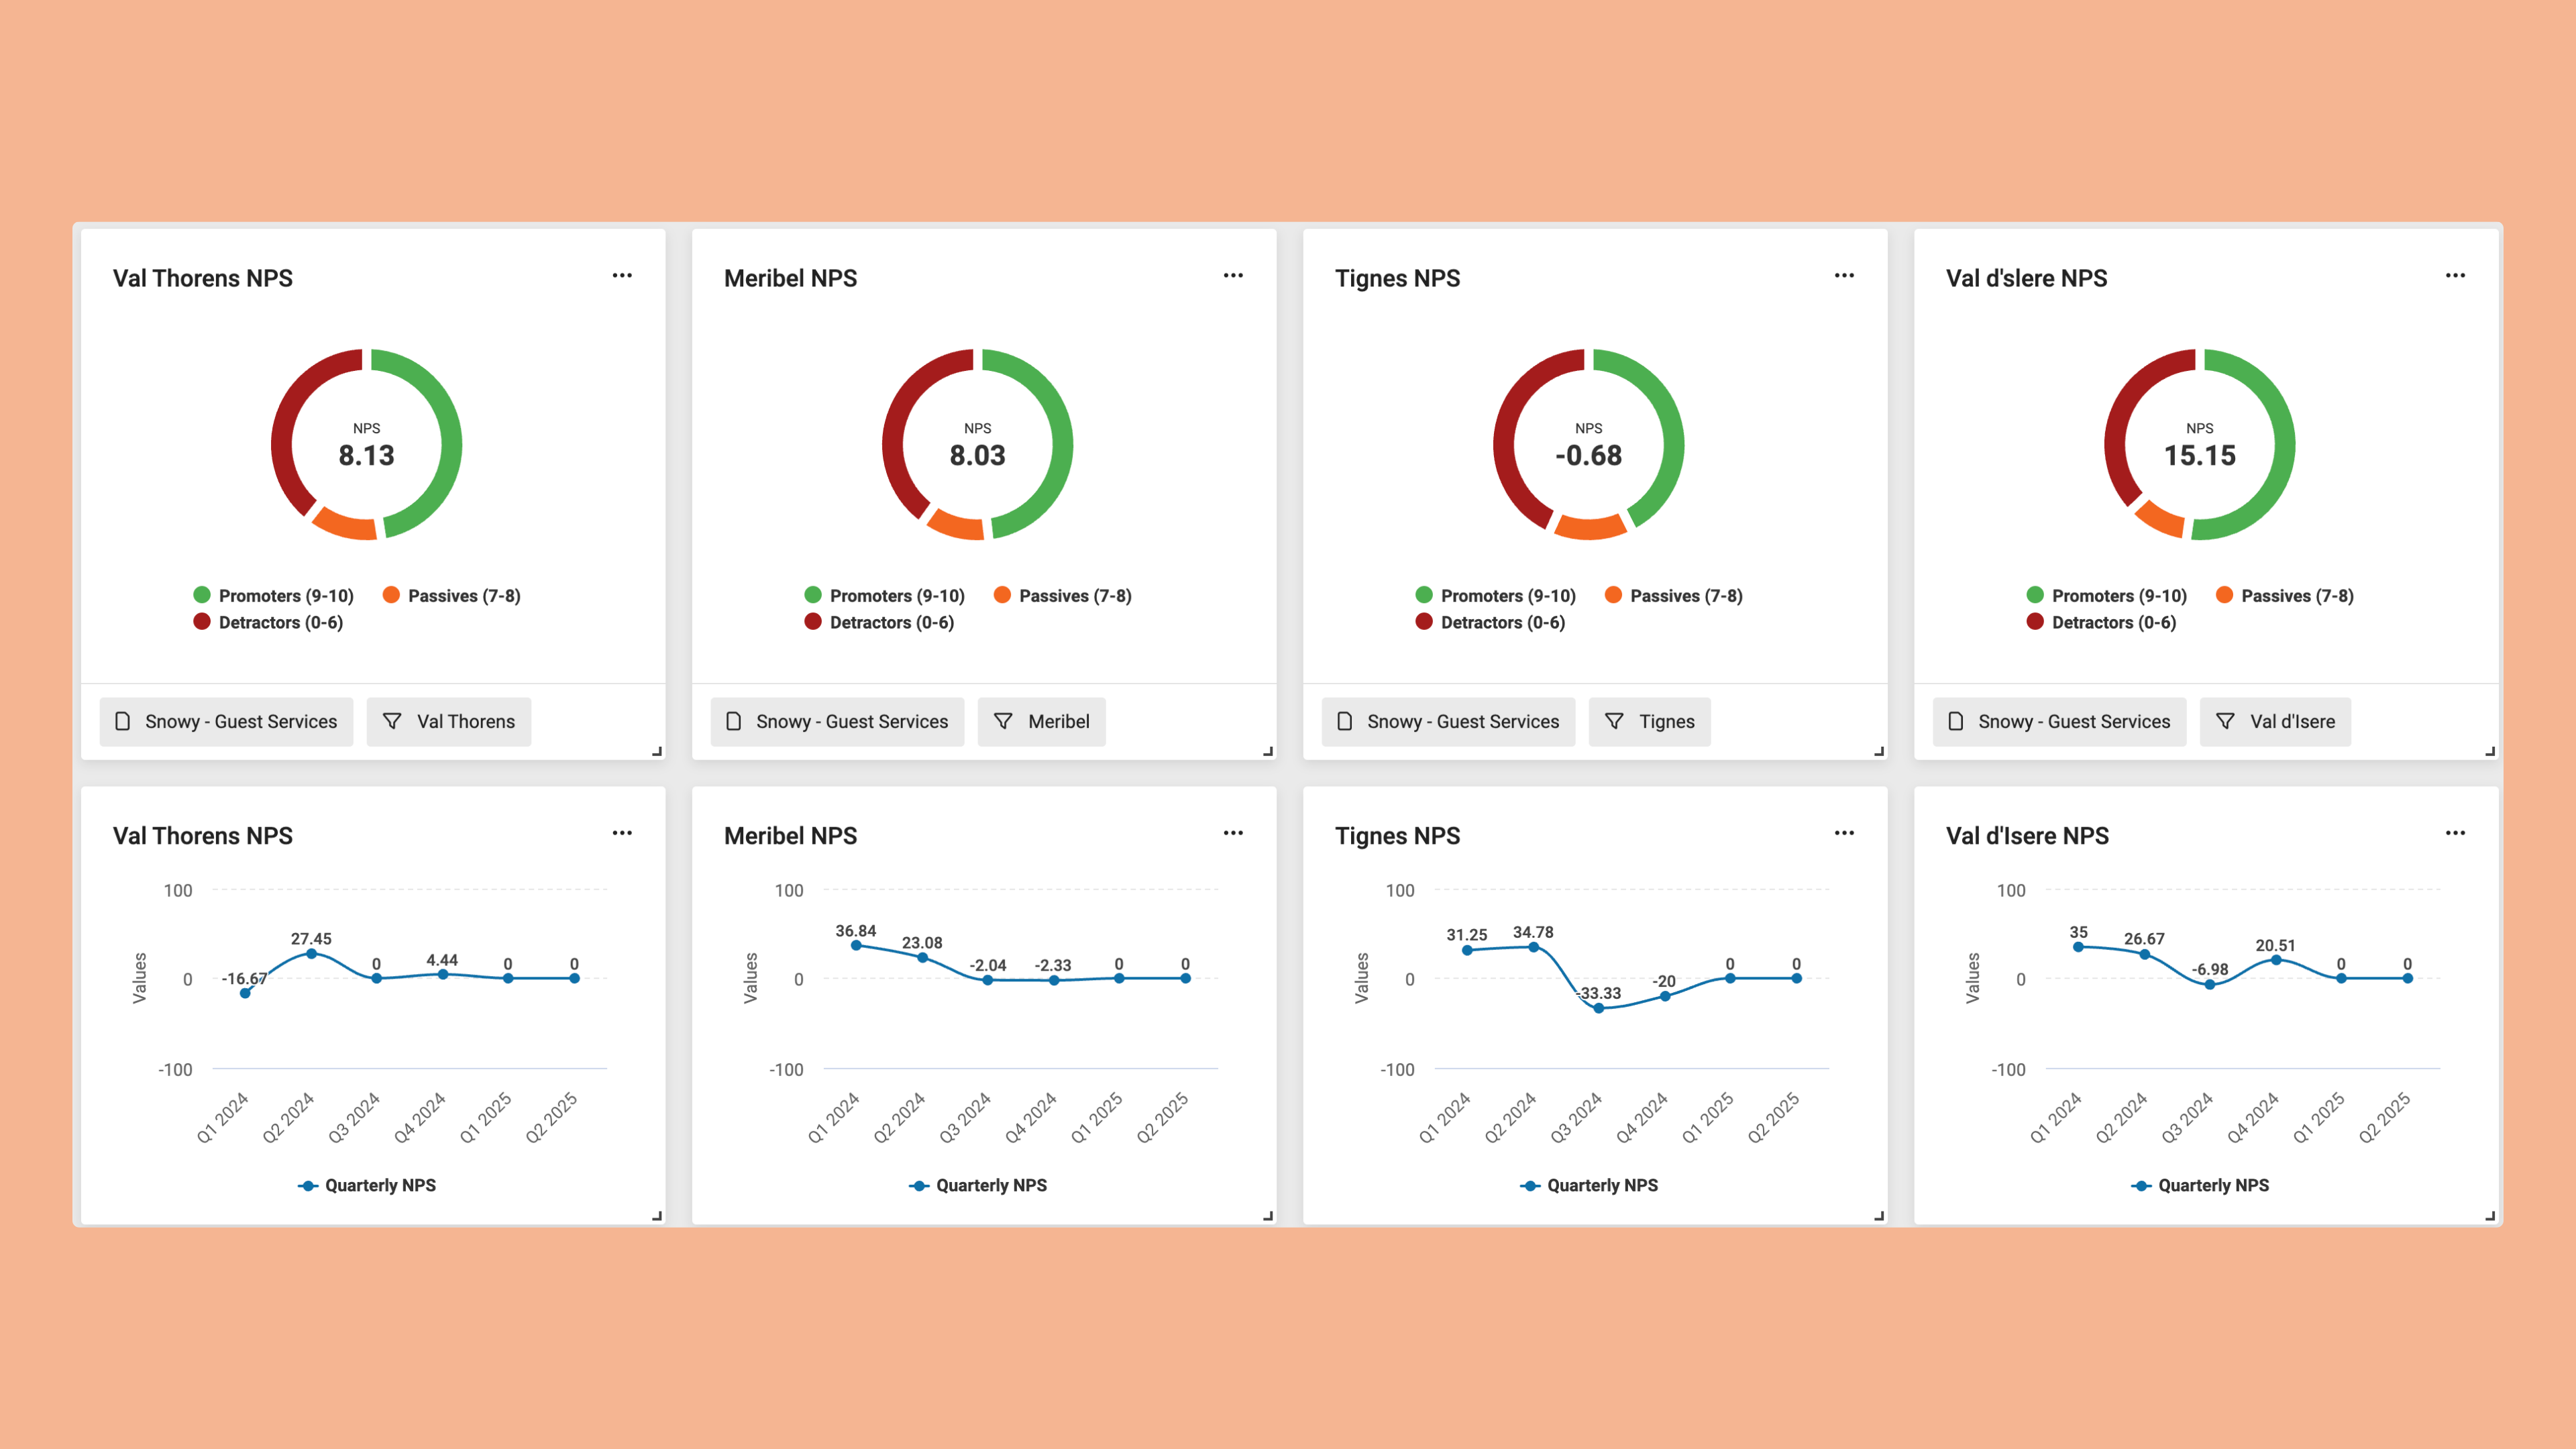
The NPS formula is calculated by subtracting the percentage of detractors from the percentage of promoters. That’s (% of promoters - % of detractors).
What is a promoter and a detractor? Here’s a deeper explanation.
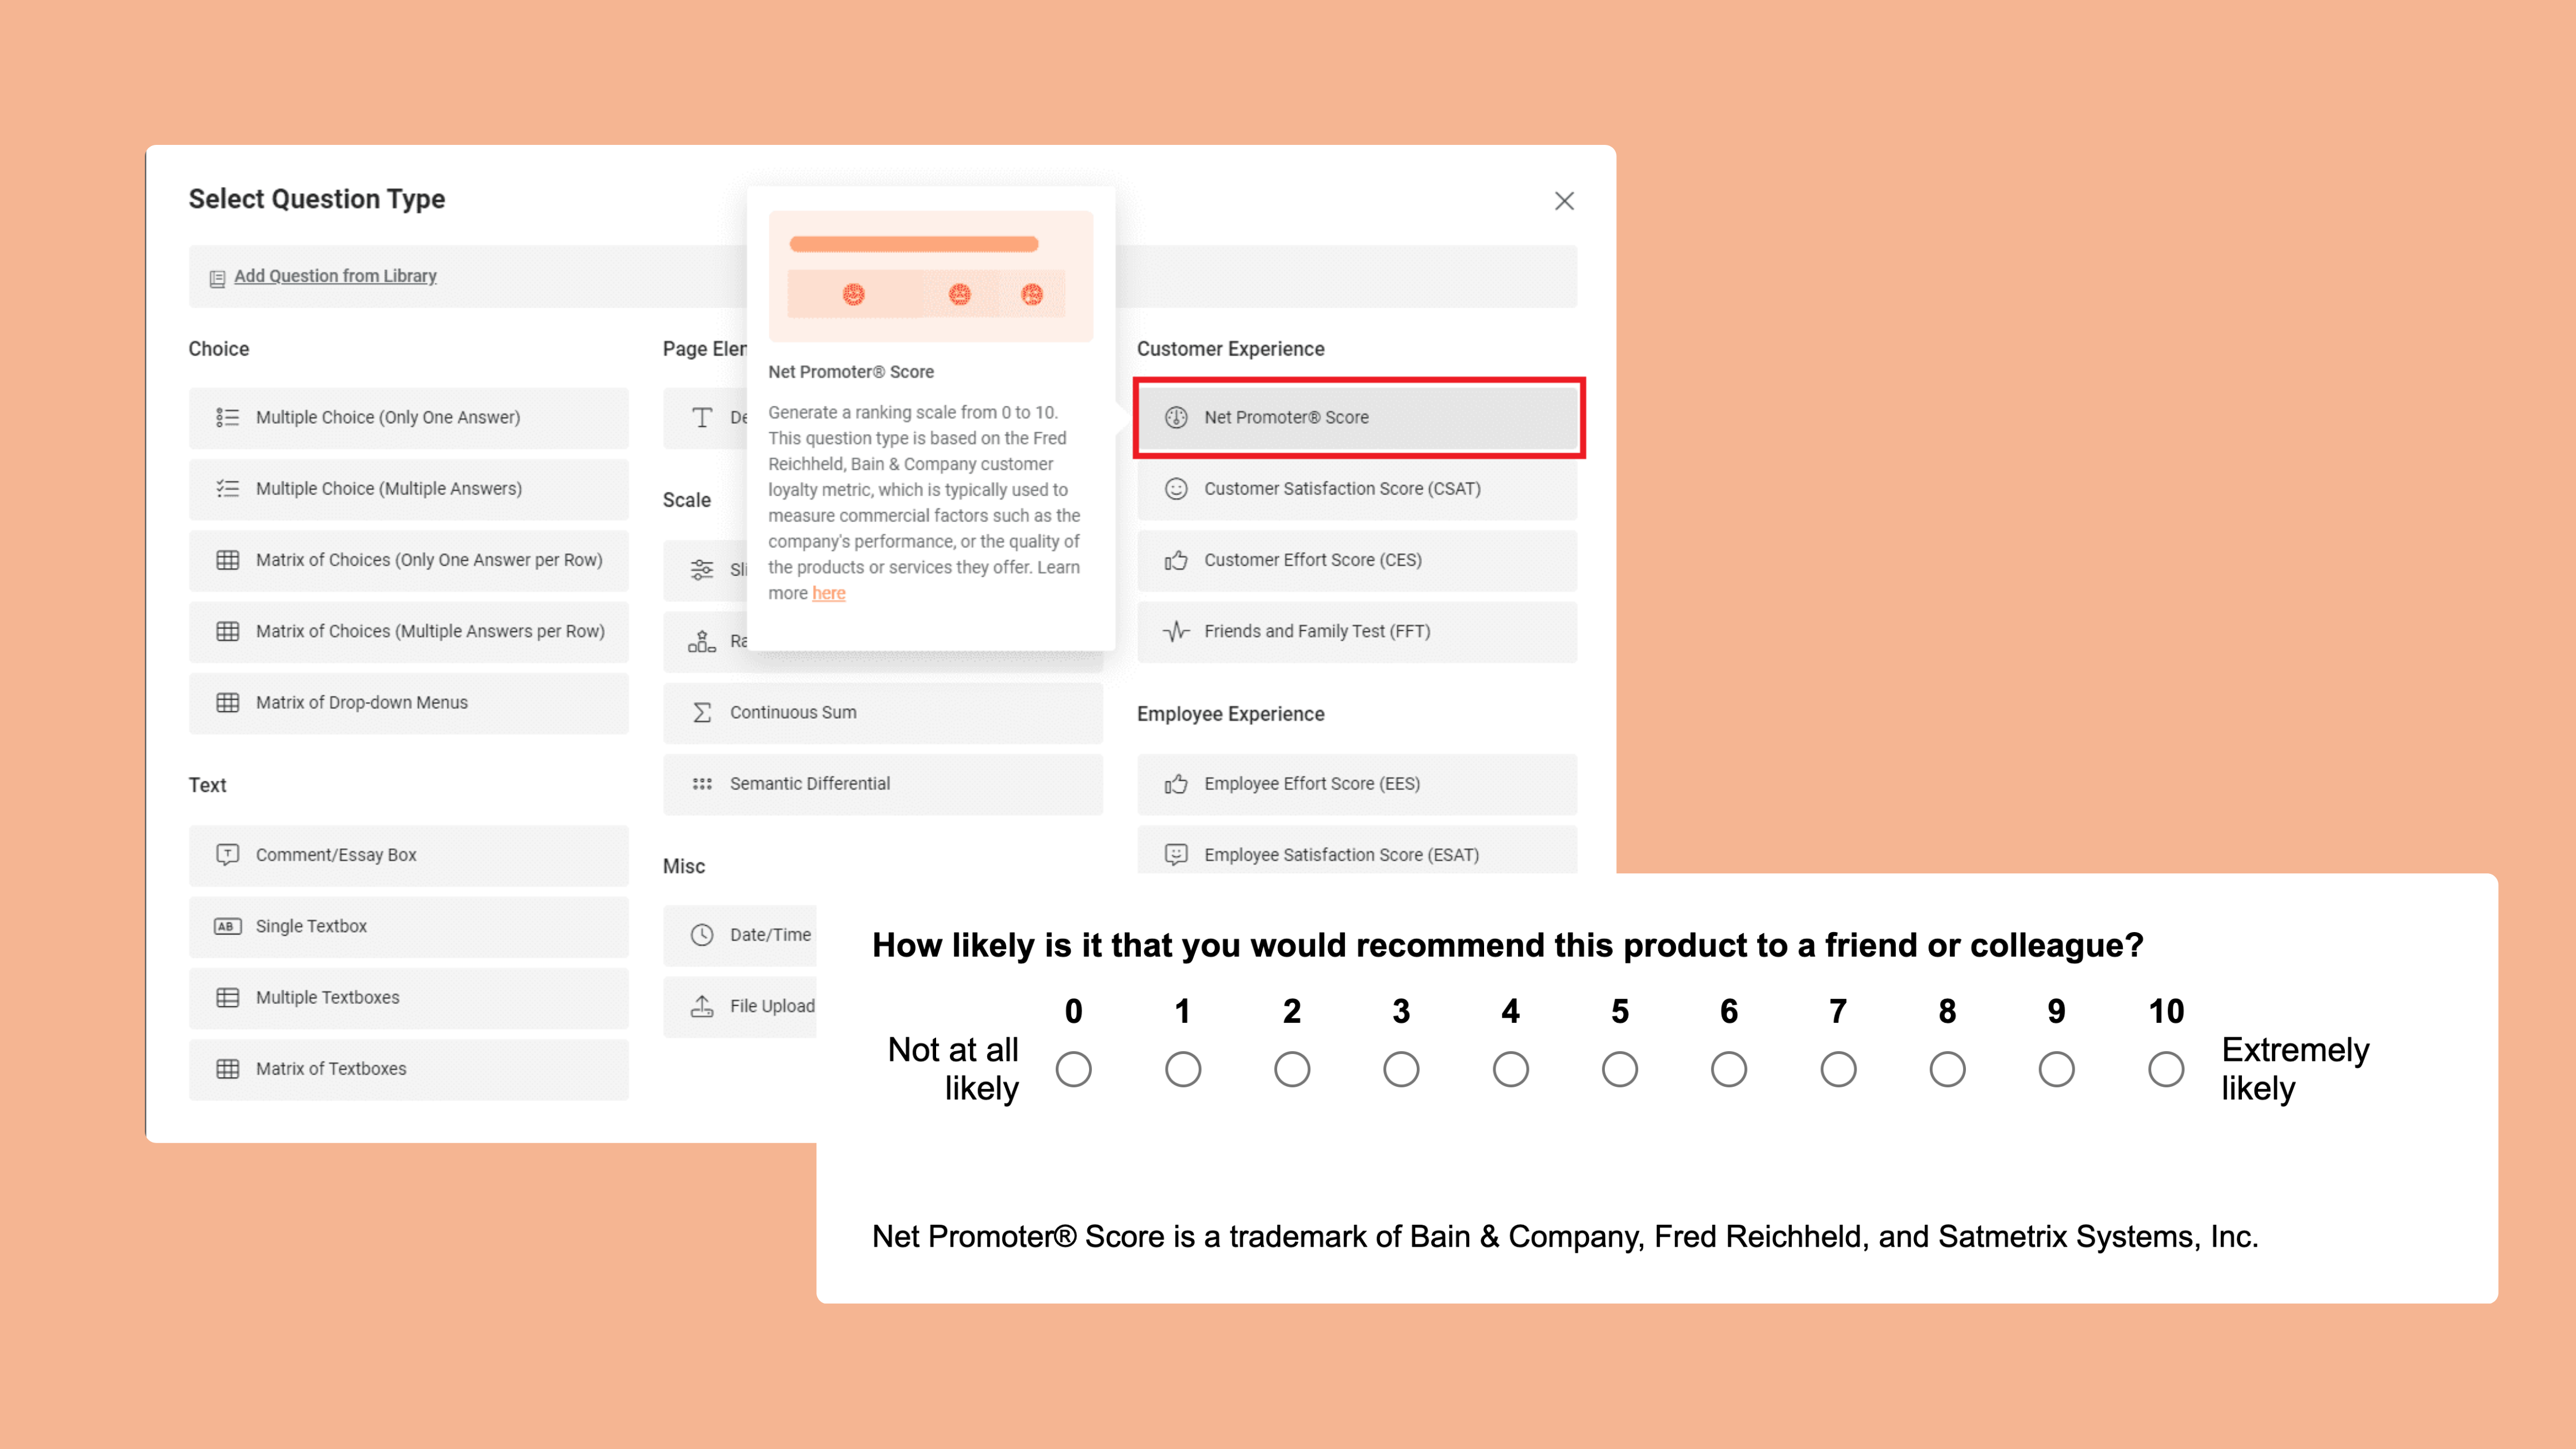
We calculate a net promoter score after a customer completes a two-minute questionnaire. It’s a short process, one that asks a critical question:
On a scale of 0-10, how likely are you to recommend us to friends, colleagues or business associates?
The goal is to understand if they would recommend (promote) your brand to others. This is the sole question on which the NPS calculation is based, though slight variations are often used.
The role of Promoters, Passives, and Detractors
The number each survey respondent chooses places them into one of three categories:
Promoter
These are the highest-ranking survey respondents. They gave you a score of 9 to 10. That means they are more likely to promote your business. That could indicate they are likely to buy from you again. They may come back to your brand numerous times. Sometimes, they refer your product, service, or brand to their friends. These customers have a high lifetime value to your company.
Passives
A passive score falls in the range of 7 or 8. While that number could still seem positive, they are only moderately satisfied individuals. They still have the potential to switch up to a promoter. However, they could also become promoters for your competitors. They are not likely to make any special effort to recommend your products or services to others.
Detractors
Anything from a 0 to 6 score falls into this category. They are unhappy customers. They’re not likely to come back to you. Even worse, the closer they are to that bottom number, the more likely they will negatively impact your brand. They may leave poor reviews. They may leave a bad social media comment.
If every one of your customers gave you a 0, you would have the worst possible NPS score of -100. If everyone gave you a 10, you’ve had a positive 100 score. Neither of these scenarios is likely – and that’s a good thing. It allows you to make changes that could influence your business decisions.
Those who fall into the category of passives will count as a respondent. As a result, they equally impact the percentage of detractors and promoters.
NPS benchmarks: comparing your score to industry standards
Now that you can see how a net promoter score works to measure the experience and satisfaction of customers, you need to know how well you rank. A higher score tells companies their customers are more loyal. However, no company will get a 100 every time.
Ideally, you can use this calculation to help you compare how well your company is doing against your competitors. In general terms, the following scoring framework applies:
- Above 0 = Good
- Above 20 = Favourable
- Above 50 = Excellent
- Above 80 = Exceptional
These are just basic figures. Most industries generally have their own “good” or “excellent” rating. The average customer experience level of each industry is based on numerous factors. In short, some industries just have a higher threshold to meet to create a positive customer experience.
Another factor that’s important to consider for business insights is the age of the person completing the survey. Typically, the percentage of promoters increases in older people, with those over the age of 65 often offering the highest satisfaction scores. Those under the age of 24 often have a much lower score.
You can apply this same logic to various areas of the world. Some countries are more likely to have a higher number of promoters than others.
The best use of this metric is to understand your industry’s average score. Using NPS software, you’ll be able to see the score data to interpret it for your demographics, target audience, or through other metrics.
Using NPS insights to improve your business
Think of NPS as a compass for your business. It allows you to know if you’re moving in the right direction or if there are some areas of opportunity available to you.
Most business owners see the value of increasing the percentage of happy customers who have a positive experience. Yet, that one positive experience isn’t enough. You need to see the bigger picture. Will they recommend you?
But what can you do with your NPS? Use it as an indicator. That NPS question is essential for understanding customer relationships with your company. It enables you to track and monitor satisfaction, performance, and value, but it’s critical to know that changing that metric is challenging.
That’s because factors contributing to whether a customer is a promoter or detractor vary by industry, promotion, and dozens of other factors. Most companies do not have a single interaction with a customer that influences their opinions and beliefs. Rather, numerous touchpoints, channels, and interactions often influence your customer’s satisfaction.
However, every time you run a survey, you have an opportunity to calculate this score. This allows you to measure satisfaction in various areas of your customer journey and compare past performance.
Feedback questions can offer some guidance. While the overall score is an important factor, open-ended questions can also contribute to directing business insights and making customer decisions.
What can we do with NPS to improve overall satisfaction and improve the ratio between promoters and detractors?
- Use NPS to detect trends over time. An upswing is a good thing.
- Measure changes in your industry over time.
- Use feedback provided in open-ended questions to adjust marketing, product features, and, ultimately, customer service.
- Note if your NPS is above the average NPS for your industry, shedding light on how well you are doing against competitors.
- Utilise customer insights to impact and improve customer retention.
- Analyse a survey response for opportunities to stand out from your peers.
Your company or brand can utilize this score to understand customer satisfaction, loyalty, and, most importantly, advocacy.
The NPS calculation, along with other metrics, helps companies tackle one of the most costly elements of business - losing a customer because of poor service, missed opportunities, lack of communication, or simply an untouched experience.
The impact of Net Promoter Score on business growth
Another way to look at your net promoter score is to consider how it offers insight into potential growth for your business. Simple questions and NPS data can provide valuable insight into potential revenue growth.
For example, surveys indicate that improving NPS can help increase revenue growth. A 7% increase in your NPS could translate into a 1% increase in revenue overall. Consider that this is influenced by factors such as your current score and your industry. Yet, improving customer loyalty is always going to have a positive influence on your revenue generation.
To achieve this, you must conduct NPS research on a routine basis, often several times per year. By capturing customer feedback like this frequently, a business may be better able to increase customer retention. It’s also an opportunity to move passives into positive territory. Surveying your customers more than once a year provides valuable insights you can apply in near real-time.
Another reason to track NPS is to reduce the cost of customer acquisition. You learn more about customer needs and can tailor your efforts to the target market, which is most likely to become your promoters, with a high customer lifetime value. By working to minimize detractors, you’re also reducing churn. With less churn, you have higher resells.
Customer feedback and the NPS survey process
Using net promoter scores is a starting point. The real opportunity comes from the qualitative feedback that comes from that score. You can create actionable decisions to influence customer loyalty and experience from that feedback.
- Collect surveys consistently. Then, they will be analysed over time for trends.
- Segment the feedback received based on demographics, product lines, or specific sectors of your business
- Look for common themes left in both defector and promoter feedback
- Use NPS data alongside other business metrics to create a more holistic, clear view of your business’s opportunities.
The responses you obtain can help management better understand their clients. When you meld this data with other business metrics, you get a clear understanding of your customers' experiences. Customer feedback like this will change over time after promotions and new product launches. Using it consistently aids in demonstrating how well any effort you take is going.
Common mistakes when measuring NPS and how to avoid them
Your net promoter score is a critical metric but not a static number. It differs based on the product or service, customer age, customer needs in your sector, and dozens of other factors. Now, consider these potential mistakes and how to avoid them with NPS calculation and use.
Asking the wrong question
Avoid overcomplicating the NPS question. That does not enhance your understanding of customer feedback. Utilise follow-up questions to get more elaborate details and customer insights, especially from promoters and detractors.
Believing it's just a customer experience metric
NPS is a metric that examines product, marketing, customer experience, and leadership. It focuses on the overarching question: Will customers recommend you? Don’t focus on just one customer experience; focus on the whole package and how well they would advocate for your business.
Focusing on just the score
Customer needs are far more than just their experience in a single interaction. NPS is valuable, but you need other metrics to propel your decision-making. Those could include Customer Effort Score, Customer Satisfaction Score, and Voice of Customer Score.
Failing to segment data
Customer feedback differs by segment. Segmentation enables your business to have a more helpful and in-depth view of each group of customers.
Not using a custom NPS survey template
You can create a custom NPS survey template that remains on brand for your company. Work with our service to ensure you’re getting the most out of every survey you run.
How to get started with Net Promoter Score for your business
Customer advocacy directly impacts a business’s bottom line. Respondents to your net promoter survey will ultimately help you make decisions. Yet, to achieve these goals and obtain customer feedback, you need to run NPS surveys frequently.
SmartSurvey offers NPS support through an interactive, intuitive system that’s easy to customize. The data collected allows your business to gauge where it is and provides an expert view of what matters most to your customers. Ultimately, you need their loyalty, as it directly impacts your business's growth and reach.
Now is the ideal time to implement strategies to improve advocacy and loyalty. SmartSurvey makes it possible to get started immediately.
Net Promoter Score FAQs
What is Net Promoter Score?
A Net Promoter Score is a measure of how happy your customers are with your business. NPS is based on two core ideas:
The first is that the most reliable way to measure customer satisfaction is to is to ask how likely a customer is to recommend your business to a friend or colleague.
The second is that customers fall into three broad types, or NPS groups: Detractors, Passives, and Promoters.
See also: Employee Net Promoter Score (eNPS).
Net Promoter Score question
Asking your customers the question “How likely is it that you would recommend this company to a friend or colleague?”, you invite them to give a value from 0 to 10.
Read more about the Net Promoter Score question.
What is a good NPS score?
The breakdown of the NPS groups goes like this:
NPS Detractors (Score 0-6)
These are customers who aren’t happy with your business for one reason or another. These customers are most likely to spread bad messages about your business, either by word-of-mouth, or on social media.
NPS Passives (Score 7-8)
These customers are satisfied, but not enthused by your business. They represent indifferent users who could be swayed to move to your competition.
NPS Promoters (Score 9-10)
Customers who love your business, and want to spread the word on your behalf.
Read more about what makes a good NPS score.
Advantages of Net Promoter Score
Because Net Promoter Scores are a standardised measure based on a single question, it makes it easy to compare your performance both over time and to other businesses in your industry or sector.
For your customers, asking a simple and quick question means that they’re more likely to give you a response where a more involved survey may be off-putting.
For the people in your business, it introduces a quantifiable measure, based on simple terminology; the benefit being an easy-to-understand measure of customer satisfaction.
Read more about the benefits of Net Promoter Score.
How do I use NPS with SmartSurvey?
We’ve introduced a pre-set question type to our survey software so you can quickly and easily add the NPS question to any survey that you create.
The Net Promoter Score question is available out-of-the-box with our Business plan or above, or can be constructed in our survey builder.
Net Promoter Score calculation

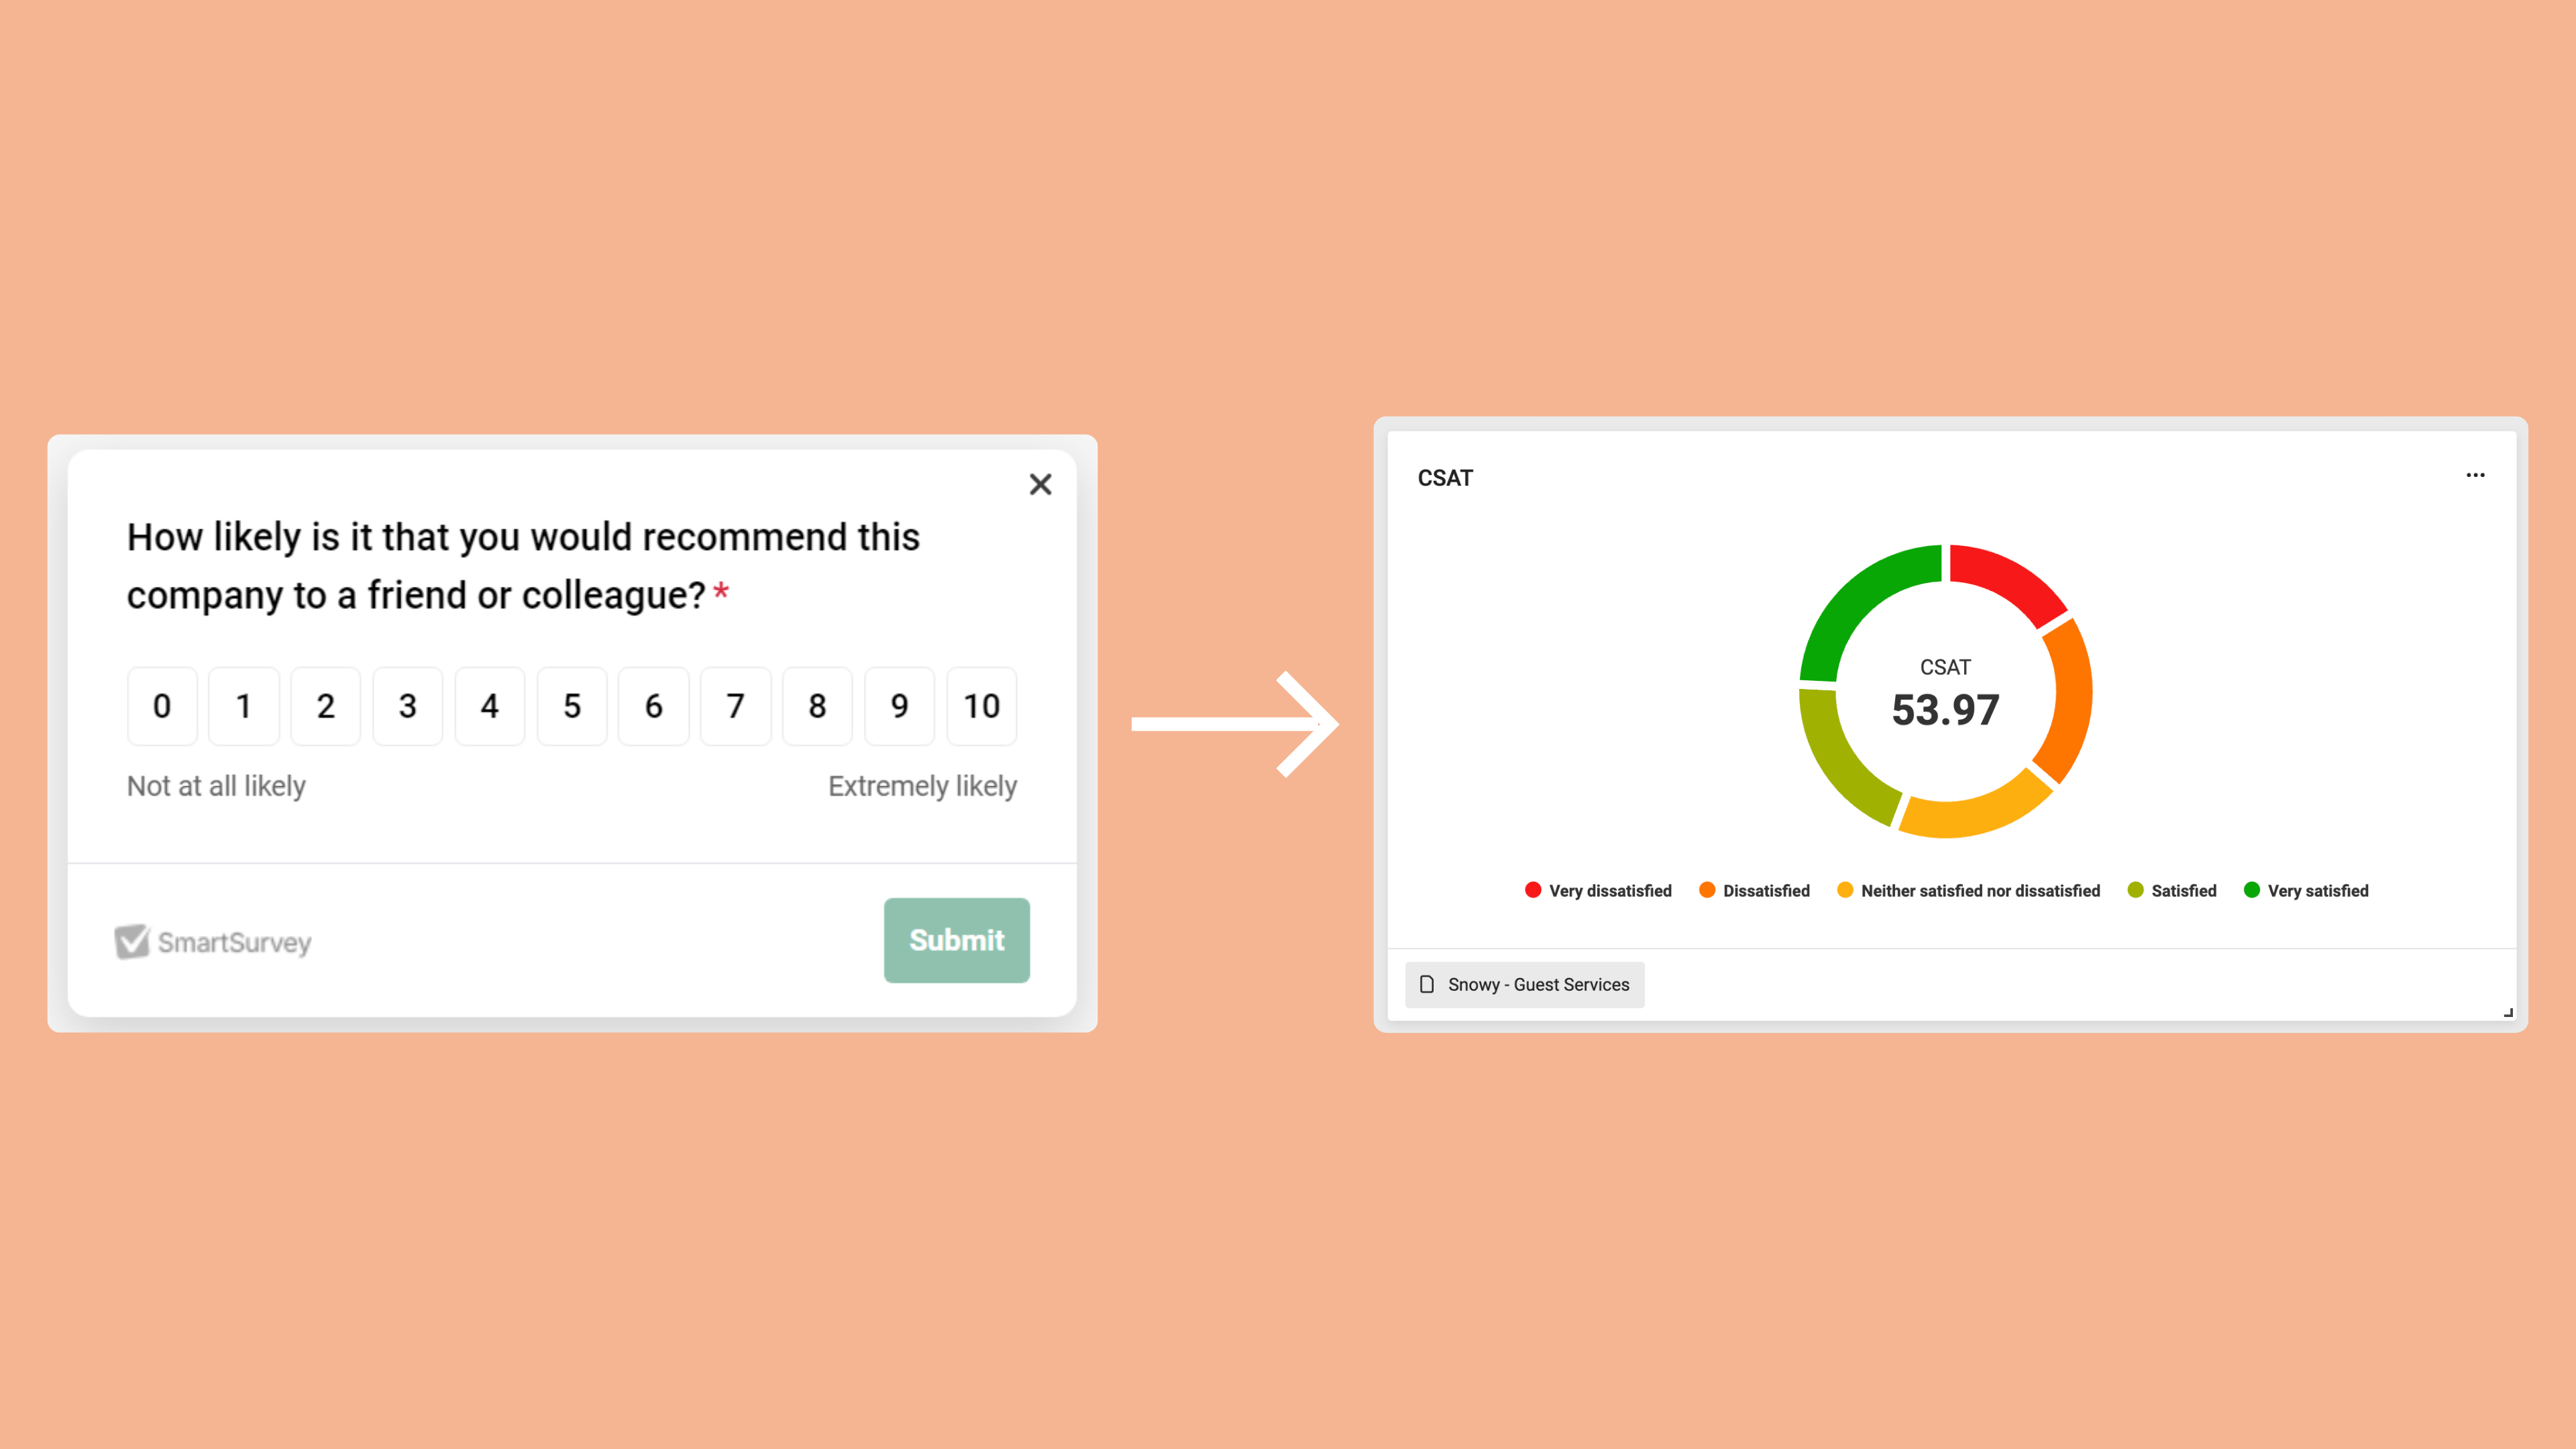
Once your NPS survey is complete, and you’ve collated the results, you’ll need to do a simple calculation to get your final score. You can do this quickly and easily by using a free NPS calculator like our own, illustrated above, or use a manual calculation to identify your score.
First of all, you need to identify the numbers for two of the three NPS groups, Detractors and Promoters.
Start with the number of Promoters and subtract the number of Detractors. Divide the answer by the number of responses in total. Then multiply your answer by 100. The number you get, rounded to the nearest whole number, is your NPS score.
For large survey sets, that could be tricky, but you can calculate Net Promoter Score in excel using a single calculation by using the following formula:
=ROUNDUP((100*((COUNTIF([Data],">8")-COUNTIF([Data],"<7"))/COUNT([Data]))),0)
Just replace [Data] with the location of the NPS answer data range in your response spreadsheet.
If that still seems too tricky, then don't worry. If you have your responses already collected, you can use our free NPS calculator to get an overall score. Or use the pre-set Net Promoter Score question when creating your survey in SmartSurvey, and let our software calculate your NPS for you.
Read more about how NPS is calculated.
Interpreting NPS
The lowest possible Net Promoter Score is -100, and the highest possible is 100, with zero being in the middle.
Any given score isn't necessarily good or bad, it has to be taken in context, either compared to your own business's performance over time (is it going up? then that's good), or benchmarked against other businesses in your sector. How do you get those benchmarks? Well, you can ask your customers how they feel about your competitors directly using SmartSurvey, or alternatively, benchmark reports for various industry sectors can be bought online.
With a simple focus, and a clear message to your business, the benefits of tracking Net Promoter Scores lie I the ability to get a clear idea of the challenges that face your business.
What does Net Promoter Score mean?
Net Promoter Score is concerned with measuring a customer's willingness to recommend a company's products or services to others, based on an index ranging from -100 to 100. It's used to help gauge a customer's overall satisfaction with a company's product or service and their loyalty to that brand.
How does NPS work?
Net Promoter Score works by getting organisations to ask their customers the standardised NPS question "On a scale from 0 to 10, how likely are you to recommend this product/company to a friend or colleague?".
Respondents' answers are then grouped according to whether they are detractors, neutral or promoters. The difference between the proportion of promoters and detractors is then calculated to generate an NPS score, giving a clearer picture about customer satisfaction levels.
What is Net Promoter Score used for?
By enabling organisations to track and measure how they are perceived by their customers, Net Promoter Score, which helps measure the loyalty of customers towards a company, is typically viewed as the gold standard metric in helping organisations measure the success of their customer experience programmes.
Is NPS a good metric
While NPS offers a great way to focus people's attention on customer loyalty, it's not strong enough as a stand-alone metric. To fully understand and improve your customers' loyalty towards you, you need a much more strategic and systematic approach to measuring it and taking follow up actions.
Is Net promoter score a percentage?
No, you work out your Net Promoter Score first, by calculating the difference between the percentage of your Promoters and Detractors. Then your NSP is expressed as an absolute number between -100 and +100. For example, if you have 30% Promoters, 50% Passives and 20% Detractors, your NPS is +10.
Why is NPS so important?
Organisations use Net Promoter Score, or 'NPS', to measure customer satisfaction and quickly assess their brand's health and the loyalty shown towards it. NPS is also valuable in enabling organisations to see how their customer service is perceived, where improvements might be made and benchmark their performance against others in their industry.
Is Net Promoter Score useful?
While NPS cannot give you a precise insight into customers' feelings and why they rated you the way they did, it's still valuable. It gives you a baseline from which to gauge the success of any improvements you have made, by viewing the respective changes in your score.
Who uses Net Promoter Score?
At least two-thirds of the Fortune 1000 use Net Promoter Score, including most or all financial service, airline, retail and telecom companies. Its benefits mean NPS has also moved into the C-suites of the largest companies and owner offices of thousands of smaller ones, broadly extending its global reach.
When should you run an NPS survey?
The best time to run your NPS survey depends on your business type. For example:
- A SaaS (Software as a Service) business typically asks the NPS question 30 days after sign-up - giving users time to get familiar with their service
- Businesses that own a service but not the final product (think eBay or Booking.com) typically ask the question when an order is placed/transaction completed - the point at which the customers' experience with the business ends and a third party provides the product or service
What should you ask when you run an NPS survey?
The standard NPS question asks, "On a scale from 0 to 10, how likely are you to recommend this product/company to a friend or colleague?". A strong NPS survey also delves to understand why, through questions including:
- What's the reasoning behind your score?
- What can we do to improve your score?
These additional qualitative answers reveal what's working for a company's most satisfied customers, and what's causing any negative experience – to help resolve and improve the latter.
How to improve NPS
Having calculated your Net Promoter Score, there's 6 key steps to help further improve your NPS. Encourage internal buy-in. Make it easy for people to promote your brand. Engage with your promoters, but don't ignore your detractors. Respond to your customers. Maintain consistency. And finally keep monitoring and improving your score.
What is difference between NPS and eNPS?
eNPS stands for Employee Net Promoter Score. While both NPS and eNPS measure loyalty they target difference audiences. NPS typically measures results from customers or members, while eNPS is more concerned with measuring the results and company ratings provided by employees.
What does eNPS measure?
The employee Net Promoter Score (eNPS), or Employee NPS as it's otherwise known, allows you to measure your staff members' willingness to be ambassadors for your company by advocating employment there. It's based on the Net Promoter Score, developed by Bain & Company and Fred Reichheld to measure customer loyalty.
What is a good Net Promoter Score for employees?
Given that eNPS can range from -100 to 100, then technically, a good Net Promoter Score is anything above zero, since this implies that you have more promoters than detractors. However, more generally, a score between 10-30 is considered good, above 50 excellent and one above 70 outstanding (and rare).
NPS®, Net Promoter® & Net Promoter Score® are registered trademarks of Satmetrix Systems, Inc., Bain & Company and Fred Reichheld.

