
The Employee Dashboard: Essential Insights For Business Success
When it comes to your organisation, your staff are your most important asset, because if they’re performing to the best of their abilities, your business will go from strength to strength. Yet, to achieve this, you’ll need to keep them happy, productive and loyal, which is easier said than done if you have no way of identifying what's going on with that workforce.
However, if you’re using the right KPIs and obtaining employee feedback using the most appropriate surveys and metrics, you’ll be well on the way to attaining the staff performance you need. But for the very best results you also need an effective way of tracking and analysing these data insights in one place, so that you’re always aware of the most urgent issues you need to address. Subsequently, this is where the value of using an employee dashboard quickly becomes evident.
Read on to find out more about employee dashboards, why they’re important, and the key insights you should be looking to collect from your staff, if you’re to make your business more successful.
Why is an employee dashboard important?
Traditionally obtaining insights from KPIs, employee surveys and EX metrics has involved looking for data that is often held in multiple places and on different platforms.
Fortunately, with the emergence of survey dashboard technology, where everything is held and viewable in one place, we now have a much more effective way of obtaining and managing this data.
To reinforce this point, here are some key issues that a single employee dashboard helps resolve, compared with the more traditional way of managing staff data.
Data silos
As everyone is now reviewing the same insights – not data held in different places, which may be subject to discrepancies including how well those data sets have been kept up to date – an employee dashboard ensures there are no more data silos or associated problems to worry about.
Developing staff issues
With a dashboard instantly updated whenever data is pulled through from different KPIs, surveys and metrics, as and when an employee adds a new response or score, there’s less risk of missing developing staff issues that might become more critical if they’re not immediately addressed.
Amount of time and resources spent on data analysis
With the ability to pull and compare data sets from any account, then view them on the same page, it’s much simpler and faster to get to your most interesting data insights. This ensures you can reduce, rather than increase the amount of time and resources you spend on data analysis, which is particularly important when your data volumes are growing.
Key insights you should be collecting with an employee dashboard
If your organisation is to get the most value from creating an employee feedback dashboard, it’s essential that you’re collecting the right data insights from your staff.
To help you with this we’ve outlined some of the key areas where you need to be collecting employee data and including it in your dashboard.
EX metrics
When it comes to your business, the quality of the employee experiences (EX) you deliver will have a major impact on the contentment, performance and loyalty of your staff.
Given that EX incorporates so many important areas including the technology, culture and workplace environment that you provide; it’s essential that you deliver as positive an EX as you can.
But how do you know how effective your EX is?
Well, that requires obtaining your employees’ feedback and measuring it using the following three EX metrics, employee net promoter score (eNPS), employee satisfaction score (ESAT), and the Employee Effort Score (EES).
Employee net promoter score (eNPS)
The most recognisable of all the EX metrics, eNPS enables you to quickly capture and identify the number of loyal employees your organisation has, by asking each of them the following simple question.
"On a scale of zero to ten, how likely would you be to recommend our company to others as a great place to work?" (Where those closest to zero would be least likely and those closer to ten the most likely to promote you)
Once collected and reviewed, your employees’ answers are divided into the following groups:
- Promoters – those who rated you a nine or ten and therefore considered to be your most loyal workers
- Passives – employees scoring you a seven or eight, who are seen as passives and therefore have no strong feelings towards your organisation either way
- Detractors – anyone who rated you between zero and six, who are referred to as your detractors
From here, your eNPS can be easily calculated by subtracting your percentage of detractors from your percentage of promoters, or with a handy tool such as our free eNPS calculator. Any positive score is considered good, while any score below zero means that you need to work on improving your EX and your employees’ satisfaction.
If you’re to achieve a good eNPS score, you need to be continually reaching out to your employees for feedback, keeping track of your ongoing score and making any improvements you need to your wider EX.
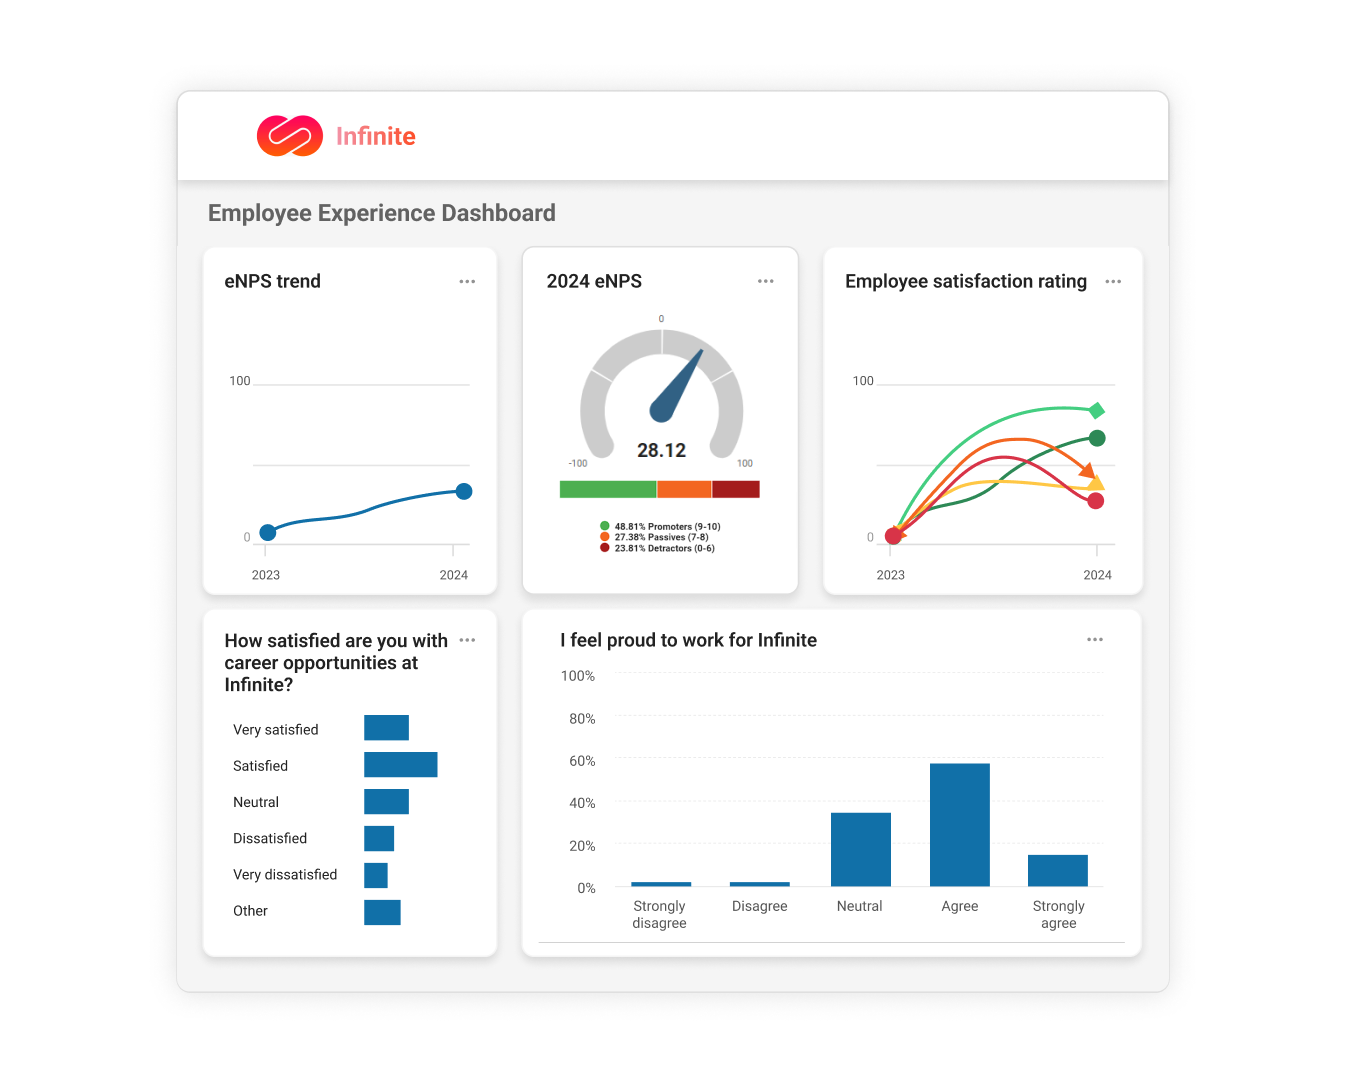
Fortunately, if you’re already using or looking to implement an employee dashboard, and its respective tools including an eNPS metric gauge and supporting trend charts, you’ll have everything you need to keep on top of this.
Employee satisfaction score (ESAT)
The next EX metric, ESAT, helps you to obtain a better picture of your employees’ contentment with your business.
You can measure their satisfaction with your business, by asking each employee the following question.
"How satisfied are you with the organisation you work for?"
Each staff member is then invited to rate their satisfaction on a 5-point scale ranging from 1 which represents “very dissatisfied” through to 5 which denotes “very satisfied”.
To calculate your ESAT score you need to take your volume of satisfied employees (those who rated you either a 4 or a 5) and divide this by your total number of responses and then multiply this by 100. For example, if 45 out of 100 of your employees rated you a 4 or 5, your overall ESAT score would be 45.
Your total ESAT score should reside somewhere between zero and 100.
Similarly, to the eNPS metric, if you have the right employee dashboard tools, it should be easy to keep track of your ongoing ESAT score, thanks to the inclusion of an ESAT metric gauge chart and supporting trend charts.
Employee effort score (EES)
The final EX metric, EES, helps you to evaluate how successful you are in providing effective employee experience for your staff. It does this by measuring the amount of effort your staff need to expend to perform their work tasks and deliver what your customers need. This is based on the tools and training you’ve provided and the processes they need to work through to complete tasks.
The idea behind this metric, is that the simpler you can make it for your employees to complete job tasks the happier they’re likely to be.
Subsequently, to measure how much effort your own staff are having to expend to complete particular tasks and processes within your organisation, you could ask them questions such as the following - based on the EES metric format.
"How simple was it to onboard with us?"
Employees responding to this question will be encouraged to select their answer, based on a 5-point scale ranging from 1 which is ‘very easy’ to 5 which represents ‘very difficult’.
For customers using our Enterprise plan, it’s simple for them to work out their overall EES, as they can take advantage of our out-of-the-box EES and ESAT questions, which feature automatic score calculations and a range of visuals to simplify their analysis of this data. In addition, those on our Enterprise Plus plan can also benefit from our dashboard tool, which allows them to better track how they’re performing with all their EX metrics, by pinning the respective metric gauge and supporting trend charts to this dashboard.
Employee surveys
While measuring and displaying the ongoing score of your EX metric questions, can be very effective in providing you with a top-level overview of the satisfaction, performance and loyalty levels of your staff; sometimes you’ll want to delve deeper into their thoughts and feelings. This is where frequently running fuller surveys such as employee satisfaction, employee engagement and employee loyalty surveys can pay real dividends, particularly if you’ve included some open-ended questions to gather this comment.
Open-ended questions can provide a wealth of information. However, it can be daunting trying to identify what’s most important and interesting, if you’re having to manually analyse all of these responses.
Fortunately, if you’re already using an employee feedback dashboard, and the technology includes Sentiment Analysis, which is the case with SmartSurvey’s Dashboard tools, then all your responses are automatically categorised as positive, negative, or neutral. This ensures you have an immediate overview of the emotional undercurrent of those responses. With the ability to drill down into specific sentiments and track sentiment changes over time, you’ll have all the tools needed to gain a more detailed picture and identify issues that require the most urgent attention to help prevent bad experiences.
Other KPIs
Depending on what you’ve chosen to display on it, one of the biggest benefits of an employee dashboard is being able to quickly get a big picture view of your most crucial data insights without having to delve through a multitude of reports. That said, besides your EX metric scores and other key survey feedback, there are some other KPIs you might consider including on your dashboard, that could help you to better evaluate staff contentment and whether they’re performing to the best of their abilities.
The best of these include:
Employee productivity
It stands to reason that if you’re able to measure staff productivity over a sustained period of time, you’ll soon be able to gauge if your employees are performing to the best of their abilities.
One of the most popular and effective ways of measuring staff productivity is to use the productivity index. In its simplest terms, the productivity index can be calculated by dividing an index of output by an index of hours worked for the same time-period.
output unit / input unit = productivity
While this is a fairly simple calculation, the context of how you might use this metric will depend on the nature of your business.
For example, if you were a manufacturing business, you would measure your productivity levels by taking the number of products an employee makes over a particular period-of- time. This would contrast with a service orientated business that is more likely to measure how many customers an employee serves over a particular period-of-time.
Data from your productivity index could then be potentially displayed on your employee dashboard, so you could track how employee performance changes over time.
Staff retention
The staff retention rate is another valuable metric to consider using. This is because the more positive your retention rate, the more obvious it is that you’re doing the right things to keep your staff happy, motivated and wanting to stay with your company.
Your employee retention rate can be easily calculated using the following formula:
Employee retention = (number of employees at the end of a defined period ÷ number of employees on the first day of that defined period) x 100
For example, let's say you had 150 members of staff working for your organisation on the 1January, with this number increasing to 155 by the end of that first financial quarter ending on 31 of March. In this case, 5 new employees would have started at your company, and your retention rate would be roughly 103%. Anything over 100% indicates that you’re doing things right in terms of creating a positive employee experience.
Similarly, to your employee productivity data, you could potentially use a range of charts and graphs to display and keep track of your staff retention rates, across different financial quarters over the course of a year. That way, it could help you be more aware of any serious trends that might be developing that you need to address.
Staff absenteeism
Finally, if you’re able to measure your staff absenteeism rates, this can also give you a good indication of how happy your employees are.
Keeping absenteeism rates as low as you can is crucial, because left unchecked it can cause significant damage to your organisation. Every time an employee is absent, it increases the workload on their colleagues, which can also be detrimental to their performance too.
Your staff absenteeism rate can be calculated using the following formula.
Absenteeism rate = (number of absences ÷ total number of workdays in a year) x 100
Typically, the lower your absenteeism rate (closer to zero) the better, as this highlights a more positive employee experience. This is because staff who are optimistic about their work environment are generally less likely to be absent, unless they are very ill or have a really valid reason for not working.
Once again, you could potentially employ a range of charts and graphs to display and keep track of your staff absenteeism rates, which would help you to be more responsive should any really negative absenteeism trends start to emerge.
Conclusion
We hope you found this blog interesting and informative, and you can recognise just how important using the right KPIs, metrics, surveys and dashboard technology is to your business.
While keeping staff happy, productive and loyal is a key objective for any organisation, being able to consistently maintain this can be a challenge with all manner of internal and external factors to deal with on an ongoing basis. However, with the right employee feedback and measurement processes in place, you’ll be able to react quicker to any changes you see, particularly negative ones, and make the improvement you need to rectify these.
Consequently, if you’re not already using them, now’s the time to introduce employee KPIs, metrics, surveys and dashboard technology into your business.

Neil has a deep understanding of software and how to bring its value to market. With experience across Human Capital Management, Learning & Development, AI-powered platforms and omnichannel communications, he knows what it takes to connect solutions with real business needs. Neil’s passionate about helping organisations turn insight into action and elevate the customer experience.

