
From weeks to seconds: how AI text analysis actually works
Manual text analysis takes 12-16 hours per 1,000 responses. AI text analysis takes seconds. But speed isn't the real value. The real value is what becomes possible when analysis is near instant: you can act while feedback's fresh, survey more frequently, and catch problems before they explode.
What you'll learn in this post:
- Why manual text analysis creates impossible backlogs
- Exactly how AI thematic analysis, sentiment scoring, and key phrase extraction work
- The specific time savings you can expect (with real numbers)
- What AI text analysis can and can't do (honest limitations)
- How to set up automated analysis in SmartSurvey step by step
- A practical implementation plan for your first month
You've just collected 847 open-text responses. Customers have told you exactly what they think about your product, your service,and your entire experience.
Now you need to read them all. Categorise them. Find patterns. And do it before the feedback goes stale.
Good luck with that.
The manual analysis trap
Here's how this usually plays out. We’ve seen it dozens of times.
Week one: Survey closes. 847 responses waiting. Someone opens a spreadsheet and starts reading. Three hours later, they've categorised 67 responses. Only 780 to go.
Week two: They get through another 134 responses between meetings. Running tally of themes in a separate document. Starting to see patterns, but not confident yet. Oh, and another 312 new responses arrive.
Week three: Backlog now at 1,025 responses. The analyst gets pulled into another project. Analysis stalls. Meanwhile, three customers who left scathing feedback have already churned.
Week four: Leadership asks for insights. Team scrambles to read 200 responses and presents 'preliminary findings.' By the time anyone acts on them, the data's six weeks old.
Why manual analysis doesn’t scale
The maths is brutal. Let’s run through it.
- Average reading speed: 250 words per minute
- Average response length: 50 words
- Time to read: 12 seconds per response
- Time to read + categorise + tag: 45–60 seconds per response
For 1,000 responses, that's 12-16 hours of pure reading time. Double it for categorisation and pattern recognition. You’re looking at three to four full working days. If someone does nothing else.
The problem isn’t that your team's slow. The problem is that human-powered text analysis simply cannot keep pace with modern feedback volume.
We have customers with surveys that receive hundreds of thousands of responses a year! Analysing just 1000 responses is tough; imagine how do you keep up when you are getting 10,000 responses a month - that’s where AI becomes invaluable.
What AI text analysis actually does
Right, let’s clear something up. AI text analysis isn’t magic. It’s pattern recognition at scale. Here’s what happens when you point it at your responses.
Thematic analysis (automatic categorisation)
SmartSurvey’s thematic analysis reads every response and groups similar concepts together. Instead of you manually tagging each response as ‘pricing complaint’ or ‘onboarding confusion’, the system works it out automatically.
What used to require reading everything first, then going back to categorise? Now happens in one pass. The AI spots patterns like:
- 147 responses mention “checkout took too long”
- 89 responses reference “pricing wasn’t clear / unexpected costs”
- 203 responses praise “friendly, helpful staff”
- 67 responses mention “out-of-stock items / limited sizes”
You get an instant view of the themes in your feedback. Without reading a single response yourself.
Sentiment scoring (emotional context) – layered on top of themes (retail)
Once SmartSurvey has grouped feedback into themes, sentiment scoring adds the “heat map” – so you can see which themes are mild grumbles and which are actively hurting the experience.
You might start with the same theme counts:
- 147 shoppers mention “checkout took too long”
- 89 customers mention “pricing wasn’t clear / unexpected costs”
- 67 customers mention “out-of-stock items / limited sizes”
But when you layer sentiment over each theme, the priority becomes obvious:
Out-of-stock / limited sizes (67 total)
- Neutral: 67 (“Didn’t have my size today”)
- Negative: 0
Annoying, but not causing real damage right now.
Unclear pricing / unexpected costs (89 total)
- Neutral: 89 (“Pricing wasn’t obvious on shelf labels”)
- Negative: 0
A clarity fix to improve confidence – but not triggering strong reactions.
Checkout took too long (147 total)
- Negative: 100 (“Queue was ridiculous, I nearly walked out”)
- Neutral: 47 (“Slight wait at the tills”)
This is the real problem: high volume and high frustration, which signals an issue that needs immediate attention.
So instead of reacting to the biggest number, you can filter by high volume + high negative sentiment and immediately see where the experience is breaking down.
The time savings are absurd
Let's go back to those 847 responses.
Manual analysis: 16–24 hours of work spread over 2–3 weeks
AI analysis: About 20 seconds
Not 20 minutes. 20 seconds.
That's not a 10x improvement. That’s closer to 2,500x.
What changes when analysis is instant
You can act while feedback’s fresh. If 15 customers mention a billing bug this morning, you know about it by lunch. Not three weeks from now when half of them have churned.
You can survey more frequently. When analysis doesn’t require days of manual work, you stop batching surveys quarterly. You can collect feedback continuously with customer experience surveys.
You can include more open-ended questions. Most surveys stick to multiple choice because open-text is ‘too hard to analyse’. With automated analysis, you can ask ‘What's your biggest frustration?’ and actually handle the answers.
You can spot problems before they explode. When you’re analysing weekly instead of monthly, you catch issues early.
What AI text analysis doesn't do
Let’s be honest about the limitations.
It doesn't make decisions for you. AI identifies patterns. You still need to decide what to do about them.
It needs volume. With 5 responses, you're probably better off reading them yourself. With 200+, AI becomes essential.
It's not a replacement for reading responses. AI gives you the themes. You still click into those themes and read actual quotes. But now you're reading strategically.
How to set up AI text analysis in SmartSurvey
Prerequisites: You’ll need a SmartSurvey account with at least one completed survey containing open-text responses.
Step 1: Navigate to your survey results
Go to your survey and click ‘Analyse Results’ from the main menu.
Step 2: Select your open-text question
Find the question you want to analyse. This works with any free-text, comment box, or open-ended question type.
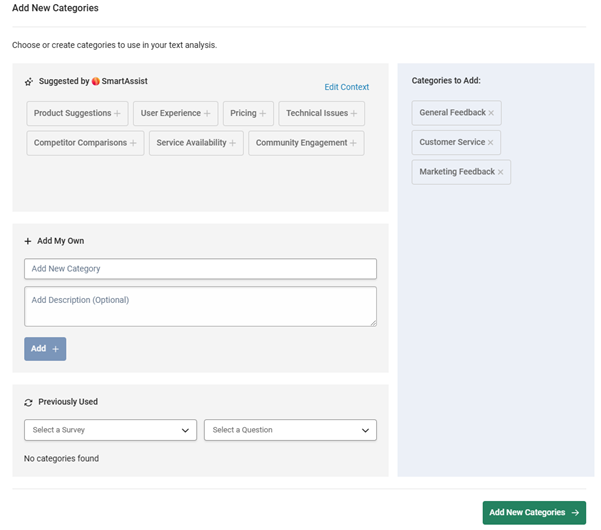
Step 3: Run thematic analysis
Click the ‘Autocategorise’ option. The AI will process all responses and group them into themes. This typically takes 15-30 seconds, depending on volume.
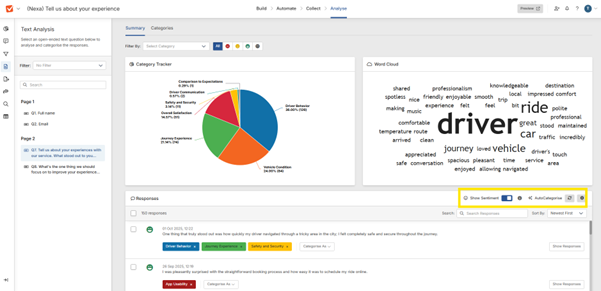
Step 4: Review the themes
You'll see a list of automatically generated themes with response counts. Click any theme to see the actual responses grouped under it.
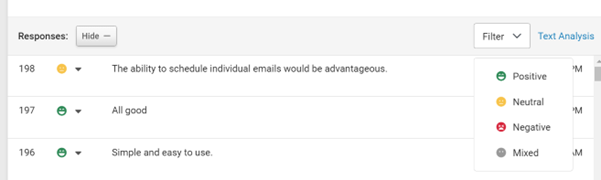
Step 5: Check sentiment overlay
Each theme shows sentiment distribution (positive/neutral/negative). Use this to prioritise which themes need immediate attention.
How to know it worked: You should see clear, readable theme categories with response counts. If themes look too broad or too narrow, you can adjust the sensitivity settings.
Common questions
How accurate is the thematic analysis?
It catches the main themes reliably. We recommend spot-checking by clicking into themes and reading a sample of responses. The AI gives you the 95% picture instantly.
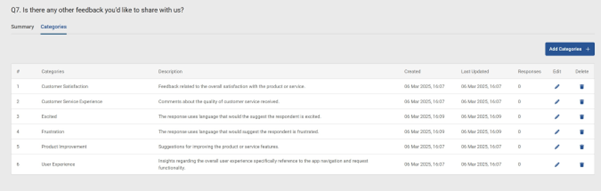
Can I customise the themes?
Yes choose to auto-generate or manually add, but you can rename them or merge similar ones for cleaner reporting.
How many responses do I need?
AI analysis works best with 100+ responses.
Here’s what matters
Manual text analysis was the only option for many years, it’s time consuming and adding more employees just for analysis is something that doesn’t work in the modern world.
AI text analysis isn’t a nice-to-have anymore. It’s infrastructure. Like email or spreadsheets. You can technically operate without it, but why would you?
The difference between VOC programmes that deliver value and those that don’t often comes down to this: can you actually analyse the feedback you collect?
Next steps
- Explore thematic analysis to see how automated categorisation works
- Add emotional context with sentiment analysis
- Build real-time survey dashboards to track trends
- See the full picture with customer experience surveys
Want to learn more? Check out our webinar
Scaling Feedback Collection: How to Capture Insights at Every Touchpoint Without Creating Survey Fatigue.
We’ll share what we’ve learned from supporting enterprise feedback programmes and hundreds of thousands of users mapping feedback to key moments, designing surveys people actually complete, and choosing the right channels for each context.
See SmartSurvey in action
Want to see how SmartSurvey’s AI analysis would work with your data? Book a demo and we’ll run them through our analysis live and show you what themes emerge.
Or start with our free plan to test it yourself: Start free

Neil has a deep understanding of software and how to bring its value to market. With experience across Human Capital Management, Learning & Development, AI-powered platforms and omnichannel communications, he knows what it takes to connect solutions with real business needs. Neil’s passionate about helping organisations turn insight into action and elevate the customer experience.

