
What’s really driving satisfaction and churn in financial services
Key highlights
Customer churn in financial services is rarely caused by a single bad experience. It builds up over time through repeated friction, unmet expectations, and the feeling that switching would be easier than staying. The organisations that retain customers best are the ones that understand exactly which experiences drive loyalty and which erode it, and they use structured feedback data to find out.
What you'll learn in this post:
- Why headline NPS and CSAT scores hide the real drivers of satisfaction and churn in financial services
- How to use thematic and sentiment analysis to identify the specific experiences that cause customers to leave
- The difference between "loud" complaints and systemic issues, and why it matters for prioritisation
- A practical framework for mapping satisfaction drivers across products, segments, and channels
- How to track churn signals in feedback data before they show up in your retention numbers
Why headline scores aren't enough
Most financial services organisations track NPS and CSAT. Many report on them monthly. But a score on its own only tells you how customers feel. It doesn't tell you why.
A Net Promoter Score of +35 might look healthy, but if it's masking a group of highly dissatisfied mortgage customers while current account holders are pulling it up, you're missing a churn risk that won't show in the average. Similarly, a CSAT score that's stable quarter on quarter could be hiding a shift in what customers are satisfied about. They might be happy with your app but increasingly frustrated with call centre wait times.
NPS and CSAT aren’t the problem they’re actually incredibly useful metrics. The problem is treating them as a definitive answer, when they’re really a headline metric aggregating multiple touchpoints and experiences. To understand what’s actually driving satisfaction and churn, you need to unpack the “why” behind the score. And even when the trend line is positive, you can still have dissatisfaction brewing beneath the surface.
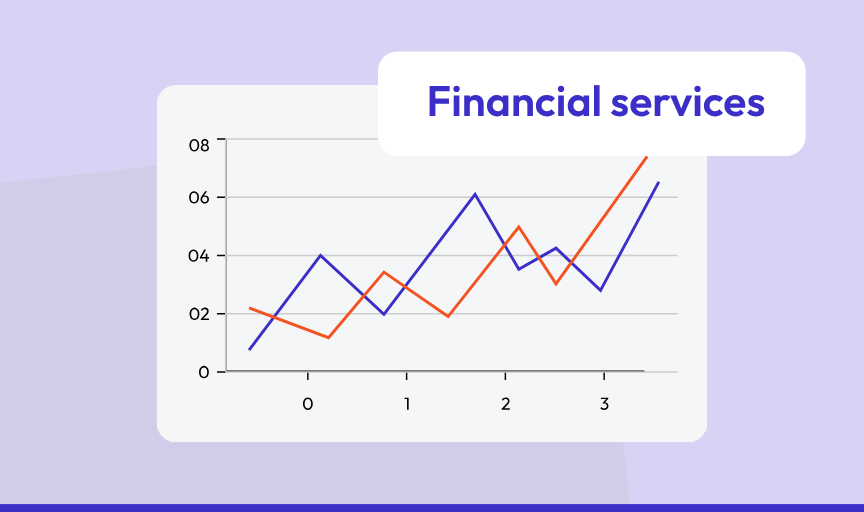
What really drives churn in financial services
Churn in financial services works differently to churn in retail or subscription services. Switching a bank account, insurance provider, or pension is more effort than cancelling a streaming subscription. That means customers who leave have usually been dissatisfied for a while. The friction of switching was just lower than the friction of staying.
When you analyse feedback data across financial services organisations, common churn drivers tend to cluster around a few themes:
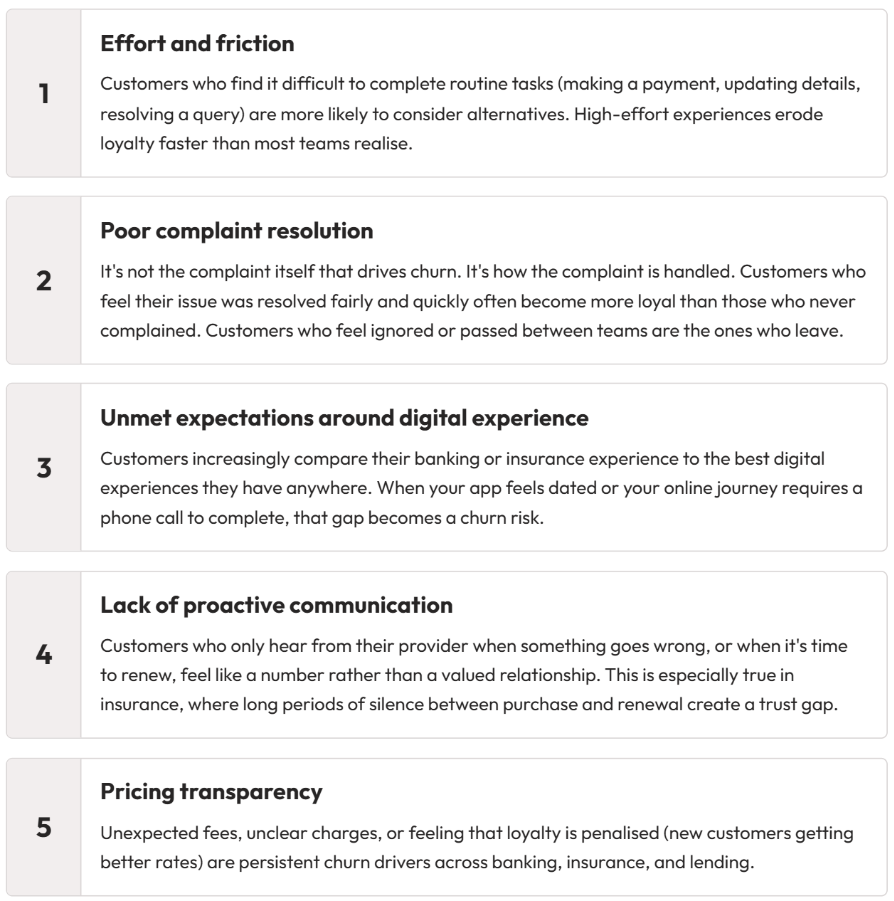
The key point is that none of these are visible in a headline NPS score. You can only surface them by analysing the open-text feedback your customers are already giving you and this need to be collected at multiple touchpoints throughout the customer journey.
How to separate "loud" complaints from systemic issues
Not all negative feedback is equal. One of the most common mistakes in feedback analysis is giving disproportionate attention to the loudest complaints rather than the most widespread ones.
A single customer writing a detailed, emotional complaint about a branch experience might get escalated and discussed in a team meeting. Meanwhile, hundreds of customers quietly giving 6 or 7 out of 10 with brief comments like "took too long" or "couldn't find what I needed online" represent a far bigger satisfaction and churn risk.
The distinction matters because your response should be different:
- Loud, individual complaints often need service recovery: a personal response, an apology, a resolution. They're important for that customer, but they don't usually point to something you need to change systemically.
- Quiet, widespread dissatisfaction needs structural change: a process redesign, a product improvement, a policy update. These are the issues that move your satisfaction and retention numbers.
Thematic analysis helps you make this distinction. By tagging and categorising open-text feedback at scale, you can see which themes appear most frequently and which have the strongest negative sentiment, regardless of how "loud" individual responses are.
A practical framework for mapping satisfaction drivers
To move from "we know our score" to "we know what's driving our score," you need a structured approach to analysing feedback. Here's a framework that works across financial services:
Step 1: Segment your feedback before you analyse it
Don't start with your overall score. Break your feedback down by product (current accounts, savings, mortgages, insurance, lending), by channel (app, website, branch, contact centre), by customer segment (new customers, long-standing customers, high-value customers), and by journey stage (onboarding, servicing, renewal, complaint). The drivers of satisfaction are different in each, and averaging across them hides the story.
Step 2: Use thematic analysis to identify recurring themes
Once your feedback is segmented, use thematic analysis to tag open-text responses into categories. AI-powered tools can do this at scale, but even manual coding works for smaller volumes. The goal is to move from individual comments to patterns. Common theme categories in financial services include: ease of use, speed of service, staff knowledge, digital experience, communication clarity, fees and charges, complaint handling, and security and trust.
Step 3: Map themes to sentiment and volume
For each theme, track two things: how often it comes up (frequency) and how customers feel about it (sentiment). This creates a simple matrix:
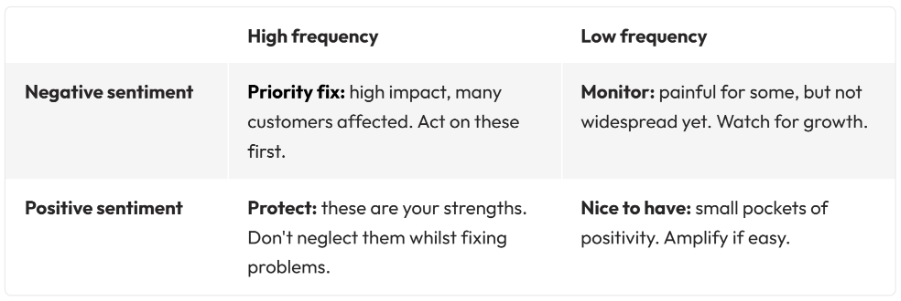
This matrix gives you a clear, defensible way to prioritise. It stops you chasing the loudest voice and focuses effort where it will have the biggest effect on overall satisfaction and retention.
Step 4: Track changes over time
Satisfaction drivers are not static. What frustrated customers last quarter may have been fixed. New issues emerge as you launch products, change processes, or as customer expectations shift. Set up regular reporting that tracks theme volume and sentiment over time, not just the headline score. This lets you see whether your improvements are landing and catch new problems early.
How to spot churn signals in feedback before customers leave
By the time a customer closes their account or switches provider, it's too late. The goal is to identify churn signals in feedback data early enough to intervene.
There are several feedback patterns that reliably predict churn risk in financial services:
- Declining NPS or CSAT for an individual customer over multiple touchpoints. A customer who scored 8 last year and 5 this year is at risk, even if your overall score is stable.
- Mentions of competitors in open-text feedback. When customers start naming alternatives ("I've seen that [competitor] offers..." or "I'm thinking of moving to..."), they're already comparing.
- Repeated contact about the same issue. If a customer has given negative feedback about the same problem more than once, they're telling you they're running out of patience.
- Effort-related language. Phrases like "too difficult," "too many steps," "had to call," and "couldn't do it online" correlate strongly with churn in digital financial services. When combined with Customer Effort Score, you get a powerful quantitative measure and trend that can be backed up with qualitative data.
Setting up alerts for these patterns means your team can intervene with proactive outreach rather than waiting for a cancellation request.
Three things you can do this week
- Pick one product or segment and run a thematic analysis on the last quarter's open-text feedback. Even a manual review of 100 responses will surface patterns that headline scores miss.
- Build a simple frequency-by-sentiment matrix for your top feedback themes. Use it in your next leadership meeting instead of (or alongside) your NPS slide. It gives stakeholders something they can act on.
- Set up a churn signal watch list. Identify 3-5 feedback patterns (like the ones above) and create a simple process to flag customers who match them for proactive follow-up.

Neil has a deep understanding of software and how to bring its value to market. With experience across Human Capital Management, Learning & Development, AI-powered platforms and omnichannel communications, he knows what it takes to connect solutions with real business needs. Neil’s passionate about helping organisations turn insight into action and elevate the customer experience.

