
The Customer Lifecycle: Stages, Metrics and Measurement
Understanding their customers is a top priority for most organisations; they realise that successful commerce extends beyond just sealing a singular deal.
In fact, leading organisations concentrate on forging mutually advantageous relationships with customers. They are aware that such an approach is more likely to foster long-term patronage and enhance customer lifetime value.
However, this focus can only be achieved by closely examining the customer lifecycle. Detailed analysis of your customer lifecycle provides invaluable insights into a customer's journey with your business. Consequently, it equips your marketing, sales, and customer service teams to convert one-time buyers into enduring clients and enthusiastic promoters.
If you are not already familiar with the customer lifecycle, we will delve deeper into this concept and discuss metrics you can employ at different stages to assess your performance and identify areas for enhancement.
Let's dive in.
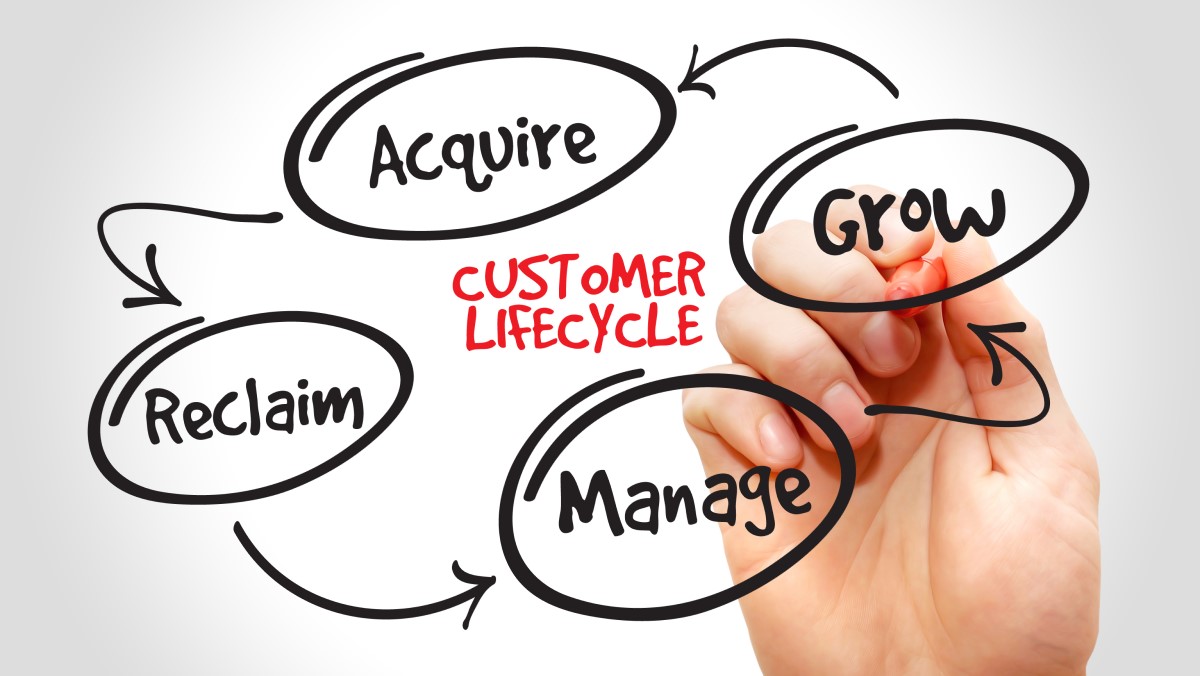
Customer lifecycle stages
The customer lifecycle stages of reach, acquisition, conversion, retention and loyalty were created from a matrix developed by marketing analysts Jim Sterne and Matt Cutler. These stages are focused on getting a potential customer's attention, teaching them what a company has to offer, converting them into paying customers, keeping them loyal, and then hoping their satisfaction with the product or service will encourage other customers to join the cycle.
Looking at each stage in sequence, they can be broken down into the following.
Reach
In this initial stage, a customer searches for a product after becoming aware that they have an issue or problem that they need to solve. And it’s during this stage, when a customer is considering what products or services may be able to help them, that you can reach out to them.
Alternatively, depending on where they’re looking, whether that’s a google search, advertisements social media, recommendations and more, they may also reach out to you.
You’ll know if you’ve been successful at this stage, if they ask you for more information or a definitive price.
Acquisition
At the point where a customer visits your website or calls you on the phone to begin conversations with your sales teams, they will have entered the acquisition stage.
Compared to the loose association between your brand and your customer’s need during the previous stage, the acquisition stage helps deepen that association.
Conversion
Having obtained all the necessary information they needed and been impressed by the customer experiences they received; this is the stage where a prospect makes their purchase.
This is also the stage where you want to deepen your understanding of your customers key purchasing criteria, as the more you can reinforce your knowledge, the stronger your competitive advantage will be moving forward.
Retention
Having acquired a new customer, this stage is all about helping your customers derive greater satisfaction and value from your products and services.
You can achieve this through phone calls or issuing surveys to your customers, to better understand their satisfaction and any issues they may be experiencing.
When you consider that it typically costs a business 5 to 25 times more to acquire a new customer than retain an existing one, it’s not hard to appreciate just how important this retention stage is.
Loyalty
At this final stage, the customer becomes an important asset for your brand, through the additional purchases that they make, which can include extra services or higher priced options.
But even more valuable than that is their brand loyalty, where customers recommend your products or services to their colleagues, family and friends.
Customer lifecycle metrics
Understanding the key stages in the customer lifecycle is just one part of the process.
If you’re to develop more longer-term customer relationships and achieve a higher customer lifetime value from them, you need to have the right metrics in place to measure how well you’re performing at each stage. Only then will you be able to see where you’re doing well and where you need to improve, so you can optimise your performance across all the stages of the customer lifecycle.
So, looking at each stage of a customer’s journey, here are some metrics you need to be thinking about.
Reach metrics
To recap. If we consider the range of channels that potential customers can look at when searching for a solution to an issue or problem, which can transcend digital, advertising and content media, typical metrics could include:
- Website traffic: at the most basic level, by tracking the number of visitors to your website, you can get a feel for the number of people considering your products as a potential solution to any issues they may have.
- Impressions: here you would be interested in measuring the number of digital views you had with a piece of content that you published, whether that be an advertisement, web page or blog post. Again, this would give you a feel for how many people were interested in what you have to offer, in terms of providing the solution they need.
- Branded search: when we talk about branded search, we’re essentially talking about a google search that includes your company or website name, or a variation of it.
When users search using your brand name, it means that they’re already aware of you. So, tracking this is useful in terms of gaining some visibility about the extent of your brand’s reach.
Acquisition metrics
We've already stated that at this stage, potential customers are more serious about exploring how you can help them and will therefore be more active in their research and enquiries with your business.
Subsequently, metrics to consider here could include:
Lead generation
Leads are part of a broader lifecycle that people will typically follow when they transition from a visitor to a customer.
For example, what we’re referring to here is someone who maybe after reading some content on one of your landing pages, completes a form with their details in order to take advantage of a promotional offer advertised on that page. Similarly, another contact may fill out another of your forms with their details, to ask a question about your product or service.
In each example, these people are looking to deepen their contact and association with your business.
Click-through Rate (CTR)
To drive traffic to your website, you will have had to have done something to get people to click a link and land on your page, whether that was via an advertisement, an email or something else.
The ratio of clicks is referred to as your click-through-rate (CTR).
To calculate your CTR, you need to divide the number of clicks to your ad by the number of impressions (how many times your ad was shown):
CTR = clicks ÷ impressions = %
For example, if you get 30 clicks to your ad and 100 impressions, the CTR would be 30/100 = 0.3 or 30%.
Customer Acquisition Cost (CAC)
Also known as cost per acquisition (CPA), this is another useful metric to use at this stage, as it helps measure the cost incurred by a business to attract and acquire a new customer.
The good thing about CAC, is that as well as the money you spend through your sales and marketing teams in areas such as advertising, this metric also takes account of other essential costs such as staffing, and anything you spend on manufacturing, producing, storing and shipping your products.
CAC can provide a good measure of a company’s growth, as it shows how many new customers were added.
To calculate your CAC, you need to add up all the costs incurred to acquire a new customer (marketing, advertising, sales, salaries, etc) and divide this total cost by the total number of customers acquired.
CAC = total costs ÷ total number of acquired customers
Conversion metrics
Having made it to the buying stage, this is the point where you’ll want to deepen your understanding of your customers key purchasing criteria, as the more you can improve your knowledge, the stronger your competitive advantage will be moving forward.
Again, some key metrics that could help you at this stage include:
Lead Conversion Rate (LCR)
We’ve talked a bit about leads already, but rather than lead generation, at this stage we’re more concerned about the conversation of this leads into customers through nurturing tactics like behaviour automation, retargeting, and email nurturing.
At this stage is all about identifying and separating customers that demonstrate high-intent behaviours from those exhibiting low intent behaviours. For example, those reading a blog piece are much less likely to be purchase ready than those that view your pricing page.
Subsequently, once you have this information you can work on nurturing those with high-intent behaviours into customers.
To calculate your LCR, you simply take your total number of conversions and divide that by your total number of leads and then multiply that by 100.
LCR = total number of conversions ÷ total number of leads x 100
Average Order Value (AOV)
Measuring the amount spent per customer order over a defined period of time is another valuable way of assessing how well you’re performing at the purchase stage.
For online stores in particular, the insight gained through this measurement can help drive key business decisions such as advertising spend, store layout, and product pricing.
Like any other business metric, AOV should be monitored regularly to check for any dips or peaks, in order that it can be more closely examined to understand what may have driven these trends. New campaigns, buying seasons, and any cosmetic alterations to a website are all possible factors that the AOV to fluctuate.
To calculate your AOV, you simply take your revenue and divide it by your total number of orders.
AOV = revenue ÷ total number of orders
Free Trial to Paid Conversion Rate
Another useful metric, particularly if you run a SaaS business.
The Free Trial to Paid Conversion Rate metric measures the percentage of users that have converted to a paid account from a trial period. It helps indicate product value by highlighting the number of users that find enough value in the product to pay for it.
To calculate your free trial rate, you’ll need to add up your number of trial-to-paid users, divide this by your total number of trial users and then multiply this by 100.
Trial conversion rate = Number of trial-to-paid users ÷ number of trial users x 100
For example, if your product has 500 trial users and 120 trial users convert to paying customers. In this case, your trial conversion rate would be:
120/500 x 100 = 24%
Retention metrics
Given how much more expensive it is to acquire new customers than it is to retain existing ones, you’ll want to find out as much as you can about how well you’re doing to keep customers.
Here are some metrics that can help you with that.
Customer Retention Rate (CRR)
This metric focuses on measuring the number of customers a company retains over a given period of time. And it’s expressed as a percentage of a company’s existing customers who remain loyal within that time frame.
It’s a useful metric to be able to use, as the more loyal customers you can nurture, the more referrals and positive feedback you’re likely to get about your products and services.
To calculate your customer retention rate, you’ll need to take the following steps:
- Take the number of customers at the end of your selected time frame and subtract the number of customers gained within that time frame
- Divide the resultant figure by the number of customers at the beginning of the period
- Multiply by 100 to get a percentage
CRR = ((CE – CA) ÷ CS) x 100
*CE = customers at the end of the period
*CA = customers acquired during the period
* CS = customers at the start of the period
Customer Churn Rate (CCR)
This is another useful metric and measures the opposite of what the customer retention rate is tracking.
For example, if your customer retention rate was 80%, your churn rate would be 20%. Basically, it’s the rate at which your customers stop doing business with you, or don’t renew their subscription with you.
Customer Lifetime Value (CLV)
Being able to predict how much income your business is likely to generate from a typical customer for as long as that account remains a customer can be very useful in terms of future planning and investment.
Fortunately, the customer lifetime value metric, can help businesses to make better forecasts in this area.
To calculate your CLV rate, you would need to work out your average customer purchase value, then multiply this by your average number of customer purchases, before multiplying this by your average customer lifespan.
For example, if the average value of a customer purchase is £75, the average number of purchases is 4, and the average customer lifespan is 4 years, the CLV would be:
CLV = £75 x 4 x 4 = £1200
Loyalty metrics
Ultimately, there’s no better recommendation than one that’s made by your own customers. So, knowing how many brand loyal customers you have and the likelihood of them recommending your products or services to their colleagues, family and friend is extremely valuable.
Fortunately, there are some metrics that can help you with this and the best of these include.
Customer Satisfaction Score (CSAT)
As one of the most commonly used methods to gauge consumer sentiment, the CSAT metric is a great metric for measuring the happiness of your customers.
It’s also fairly simple and fast to calculate, and because CSAT surveys often only ask a single question, you’re more likely to get high response rates from your customers.
The CSAT question is typically worded as follows:
"How satisfied were you with your latest service experience?"
Respondents are then required to rank their satisfaction with what they’ve been asked about on a scale of 1 – 5, where 1 represented being “very dissatisfied” and 5 represented “very satisfied”.
Following this you’ll need to add up all the responses where you’ve been given a 4 or 5 rating and divide these by your total number of responses to get your overall CSAT score, which should sit something between zero and 100.
If you’d prefer a quicker and more convenient way of measuring your customer satisfaction levels, you might like to try our CSAT calculator.
Net Promoter Score (NPS)
As one of the most recognisable customer loyalty metrics, NPS is ideal when you want to measure your customer experience and predict how the impact of customer loyalty and advocacy will affect your future growth.
Your NPS score can be measured by asking your customers the following question.
“On a scale from 0 to 10, how likely are you to recommend this product/company to a friend or colleague?” where scores between (0-6) are your NPS detractors, scores between (7-8) NPS passives and scores between (9-10) your NPS promoters.
You can then use the net promoter score formula to calculate your NPS, which helps you work out the difference between your proportion of promoters and detractors and generate a score of between -100 and 100.
However, it’s possible to calculate a relatively small dataset by simply subtracting your number of detractors from your number of promoters. This should leave you with a positive or negative number, that you would then need to divide by your total number of survey responses and multiply by 100.
The number you are then left with, when rounded to the nearest whole number, should be between 100 and –100. And the higher your score the more desirable it is.
For a speedier and simpler way of working out your NPS, you might like to try our NPS calculator.
Final thoughts
We hope you found this blog interesting and if you weren’t already, you’re now more familiar with the customer lifecycle and the key stages within it.
While we’ve discussed a lot of metrics, the most crucial thing to take away from this piece is recognition about the importance of the customer lifecycle and having some processes in place to monitor and measure its key stages. This is vital, because if you don’t know how well you’re performing, you certainly won’t know what areas you need to improve.
However, if you do put some processes and metrics in place and take on board your customers feedback, you’ll be able to build even stronger customer relationships moving forward and be more successful as a result.

Neil has a deep understanding of software and how to bring its value to market. With experience across Human Capital Management, Learning & Development, AI-powered platforms and omnichannel communications, he knows what it takes to connect solutions with real business needs. Neil’s passionate about helping organisations turn insight into action and elevate the customer experience.

